An analysis of the risk-mitigating effects of balance sheet strength in various down-markets scenarios.
Setting the Stage
At The London Company, our goal is to outperform the broader market with less volatility over full market cycles. Our investment process is designed to limit the downside in each holding and we recognize that losing less in down markets is one way to outperform over time.
While every step of our investment process is intended to mitigate risk, we believe a strong balance sheet is a key element of downside protection for a company, especially during troubled times. Companies with greater financial flexibility can weather an economic downturn and invest in the business for future growth. Key to balance sheet flexibility is maintaining a relatively low debt level while generating consistent cash flow. We recognize that a conservative amount of debt can be advantageous while too much debt can be problematic.
Our Test Composite
With that in mind, we decided to review how shares of companies with strong balance sheets have performed during downdrafts in the broader stock market. Market downturns often tie in with economic recessions, but there are more frequent material market declines than recessions. Various events can spook the market including actions from central banks, commodity spikes, geopolitical events, terrorist attacks, as well as a slowdown in any number of economic variables.
Using data from Investment Metrics, we reviewed stock price data beginning in 1990 to 2021. We reviewed monthly data and examined any period where stocks declined 20% or more over at least a three month period. The goal was to see how companies with strong balance sheets performed in those periods.
Our universe was the top 3000 stocks based on market capitalization. It is similar to the Russell 3000 Index, but not exactly the same.
To test balance sheet strength, we focused on three key metrics:
- The current ratio (current assets/current liabilities) is a measure of short term liquidity.
- The interest coverage ratio (EBIT/interest expense) is a measure of financial strength and how much flexibility a company has to cover its debt service costs.
- The debt/equity ratio (debt/equity using book value of equity) is another measure of financial strength. Keep in mind, this uses book value of equity, which can penalize companies that repurchase shares over time. The accounting rules require a company to reduce equity for any share repurchase. This is different from how we view debt/capital as part of our balance sheet optimization process, but that is a separate topic for another day.
To test each balance sheet variable, we looked at how the top 25% of stocks in each bucket traded. For current ratio and interest coverage, we looked at the companies with the highest scores (showing strength), while we looked at the lowest 25% for debt/equity (less debt).
We reviewed the results of the three metrics and also created a composite equally weighted across the three metrics. Each company received a score for each metric and then a combined score. The companies with a combined score in the top quartile make up the composite.
Going back to 1990, there were three periods when the market declined at least 20% over three months or more. In the three periods under review, the test composite of three factors outperformed in two of the downturns, providing solid evidence that balance sheet strength matters in a downturn.
Here is a review of the relative performance of the composite vs. the sample universe in each of the three periods. The chart shows the percentage difference in relative performance for the composite vs. the sample universe (top 3000 stocks by market cap).
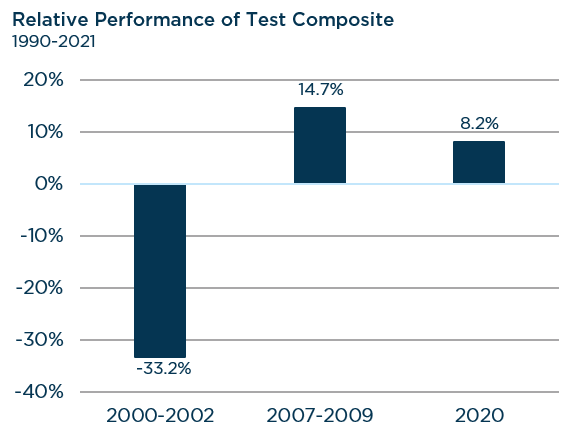
Source: Investment Metrics. Past performance should not be taken as a guarantee of future results.
There were two periods where balance sheet strength led to material outperformance. Those periods included the Great Recession (10/31/2007- 2/28/2009) and the ‘Great Lockdown’ due to COVID-19 (12/31/2019-3/31/2020). The one major outlier on the negative side makes it clear that a strong balance sheet may not protect shares that are trading at excessive valuations. Following the tech bubble in the late 1990s, many of the companies with the strongest balance sheets were in the Information Technology sector. Tech stocks didn’t hold up well largely due to the excessive valuations at the time and slowing assumptions for future growth in tech spending.
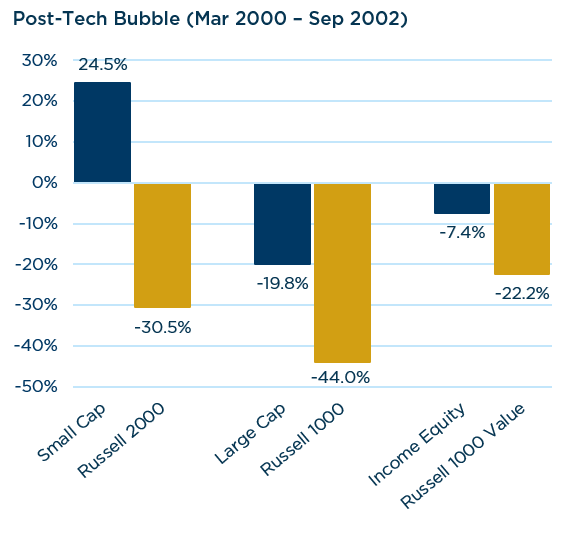
Post Tech Bubble
This was a long downdraft driven by excessive valuations for the market, especially technology stocks. The US experienced a recession in 2001 and an act of terrorism on 9/11/2001. Information Technology stocks were pricing in exorbitant growth expectations leading up to Y2K. Information Technology spending levels quickly declined post the beginning of the year 2000 and stocks suffered. The sample universe declined 45.3%. Balance sheet strength was actually a negative during that period largely because tech stocks had strong balance sheets, but very high valuations. Nothing can provide downside protection when stocks are trading at over 50x earnings and growth slows. All three metrics and the composite significantly underperformed the sample universe.
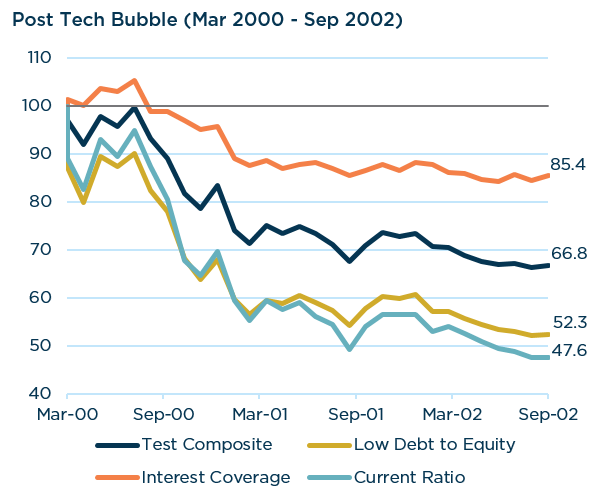
Source: Investment Metrics. Past performance should not be taken as a guarantee of future results.
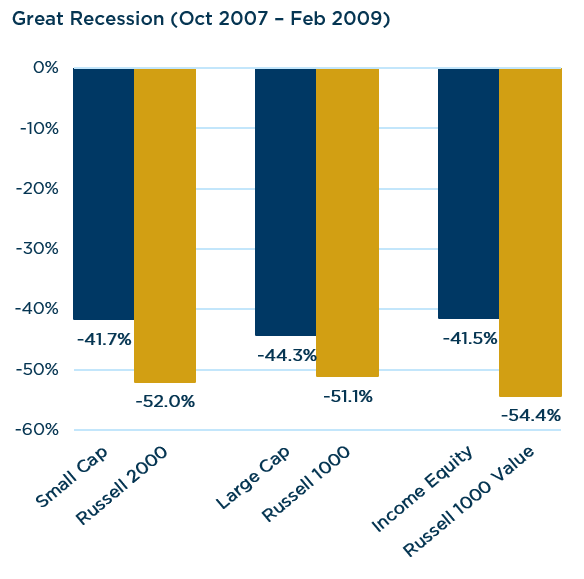
The Great Recession
This was another long downdraft that was triggered by the bursting of the housing bubble and the impact on the banking system. Most economists view this as the second worst recession in US history. Banks and consumers were forced to de-lever and it took years to dig out of this difficult period. The sample universe declined 50.3%. Balance sheet strength mattered and all three balance sheet strength metrics and the composite outperformed.
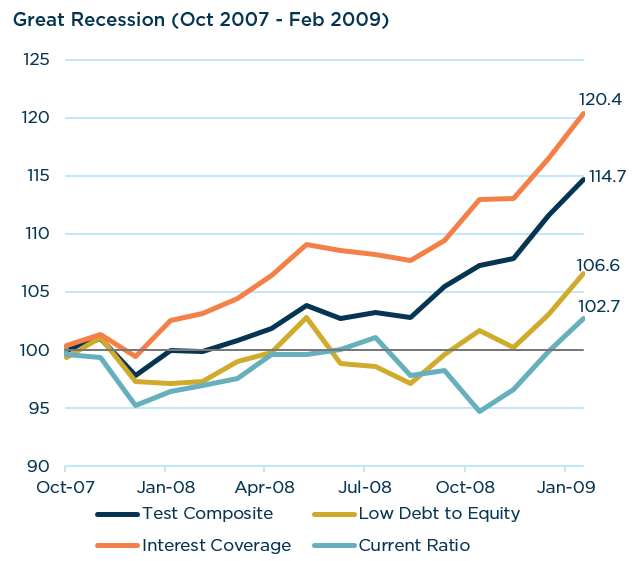
Source: Investment Metrics. Past performance should not be taken as a guarantee of future results.
The Great Lockdown
After a strong 2019 driven by a dovish pivot by the US Federal Reserve, investors were surprised by the coronavirus in early 2020. The virus started in China and quickly spread around the world leading to a global pandemic. In response to the virus, the US government mandated most businesses shut-down for a number of weeks, leading to a recession. The sample universe declined 21.3% during the three month period. Companies with strong balance sheets outperformed the broader market.
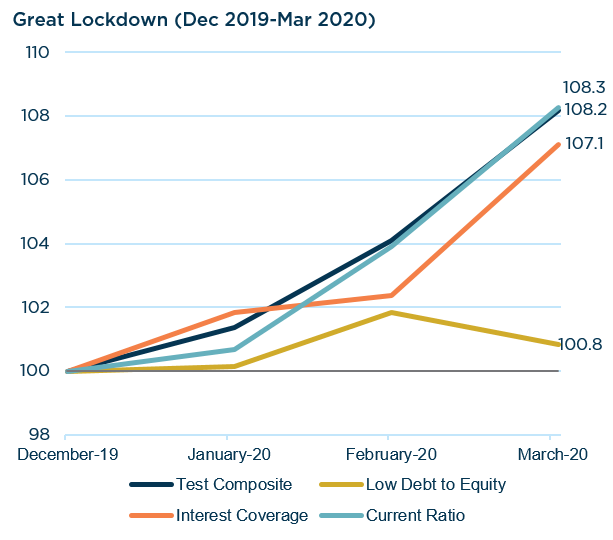
Source: Investment Metrics. Past performance should not be taken as a guarantee of future results.
We have demonstrated that balance sheet strength matters in downturns except when valuations are excessive. Fortunately, our investment process at The London Company incorporates valuation discipline using our Balance Sheet Optimization (BSO) process. BSO is how we estimate intrinsic value of a company. The goal of BSO is to build the investment thesis around the strength of what exists and the flexibility a strong balance sheet affords management. Importantly, we make conservative assumptions around future growth expectations, which will often keep us from buying more expensive stocks. That valuation discipline allowed London Company portfolios to outperform in all three significant downturns under review.
Performance of The London Company Portfolios During the Three Significant Downdrafts:
The charts below highlight the performance of London Company portfolios in each of the three time periods. During the first two periods, we managed three portfolios (Small Cap, Large Cap, and Income Equity). In the third period, we also managed a Small-Mid cap portfolio and Mid Cap portfolio.
Post-Tech Bubble
As we discussed earlier, stocks were very expensive as we entered year 2000. The most expensive stocks at the time were in the Information Technology sector. Those same stocks also happened to have strong balance sheets. However, the balance sheet strength was not enough to offset the excessive valuations. London Company portfolios had limited tech exposure at the time due to our valuation discipline. Therefore, relative performance for all three London Company portfolio was very strong. The chart below shows actual performance over the 30 month period.
Source: eVestment. Composite data reflects net performance. Past performance should not be taken as a guarantee of future results.
We have demonstrated that balance sheet strength matters in downturns except when valuations are excessive.
Great Recession
Following a multi-year rally beginning in late 2002 and extending into 2007, stocks fell significantly through the Great Recession. All asset classes were hurt during a period where the housing market crashed, banks struggled, and unemployment spiked. Each London Company portfolio outperformed its respective benchmark during this difficult 16 month period.
Source: eVestment. Composite data reflects net performance. Past performance should not be taken as a guarantee of future results.
Great Lockdown
Following the longest economic expansion in US history, stocks fell in early 2020 as a global pandemic hit. As we are writing this report, we are still dealing with COVID 19. Fortunately, the US Federal Reserve and the US Government were active with monetary and fiscal stimulus to strengthen the economy and maintain the proper functioning of markets during this difficult time. Stocks traded off for three months before beginning to rally in April.
Four of the five London Company portfolios outperformed their respective benchmarks during this brief downturn. The only portfolio to lag its benchmark was the Large Cap portfolio. Its benchmark, the Russell 1000, had greater exposure to growth factors which held up well. The Russell 1000 Index was also driven by a few large companies that made up almost 20% of the index.
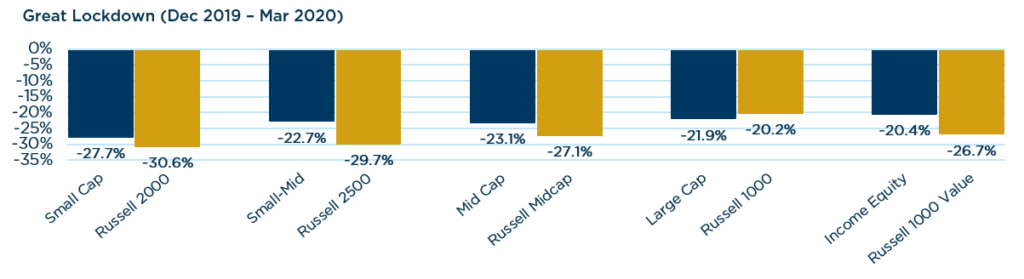
Source: eVestment. Composite data reflects net performance. Past performance should not be taken as a guarantee of future results.
Conclusion
We believe balance sheet strength matters, especially in times of greater volatility and downdrafts in the market. Balance sheet strength can’t protect against excessive valuation though. In our study, we reviewed any period of at least three months when the broader market declined by at least 20%. Companies with balance sheet flexibility held up better in two of the three downdrafts. The exception was the period following the excessive valuations of the tech bubble.
The London Company portfolios protected well in each market downdraft. The combination of sustainably high returns on capital, balance sheet strength, and consistent cash flow led to London Company portfolios outperforming their benchmarks across the market cap spectrum in each period of weakness.