Market Observations & Portfolio Commentary
Income Equity – 2025 vs R1000V
Full Year Market Update
U.S. equities posted strong gains in 2025, marking a third consecutive year of double-digit returns, with the Russell 3000 Index rising 17.2%. The year was shaped by robust earnings growth, continued AI enthusiasm driving technology leadership, and incrementally more supportive monetary policy. However, the market navigated significant volatility, particularly during the spring tariff uncertainty when the S&P 500 fell nearly 19% before recovering. The Federal Reserve reduced rates by 75 basis points in the second half of the year, responding to moderating growth and signs of labor market softening while inflation remained above target. Trade policy uncertainty and tariff developments contributed to periodic volatility, though markets generally proved resilient as implementation timelines shifted.
Like recent years, equity market leadership was again concentrated in Large Cap Growth companies, particularly within technology-oriented areas tied to artificial intelligence, as the equal-weight S&P 500 meaningfully trailed its cap-weighted counterpart. Stylistically, Growth led Value for the year, and Large Caps outperformed Small Caps. Sector performance was mixed, with cyclical leadership led by Communication Services, Technology, and Industrials, while more defensive areas lagged. Among market factors, Growth, Volatility, and Size factors posted the strongest relative returns. Momentum also helped. The Quality and Yield factors were large headwinds. The Value factor was mixed.
Key Performance Takeaways for the Year
-
The London Company Income Equity portfolio returned 14.4% (13.5% net) year-to-date vs. a 15.9% increase in the Russell 1000 Value Index. Stock selection was a headwind to relative performance, partially offset by positive sector exposure.
-
For the year, the Income Equity portfolio slightly trailed the Russell 1000 Value index but finished ahead of our 85-90% upside capture expectations. The strategy began 2025 with strong relative performance, demonstrating resilience amid the early market drawdown, and outperformed for the first three quarters. In Q4, however, Value and Volatility factors led Quality, and Yield factors were particularly weak, which weighed on relative and absolute performance for Q4. Moreover, following the Russell 1000 Value reconstitution, several Magnificent 7 names migrated into the Value benchmark, creating new opportunity-cost headwinds. Despite these headwinds, we were encouraged to see the portfolio finish in line with expectations and deliver attractive absolute returns.
-
As markets broaden and fundamentals reassert their importance, we believe high-quality companies trading at reasonable valuations offer a compelling path forward. We believe our Quality-at-a-Reasonable-Price approach may offer participation in market upside while providing the differentiation that may matter most if volatility increases or leadership shifts.
Top 3 Contributors to Relative Performance
-
Corning Inc. (GLW) – GLW has been a top performer this year after raising its medium-term outlook, primarily driven by strength in Optical Communications. GenAI is dramatically increasing data center bandwidth requirements, which is boosting demand for the GenAI-related offerings that are higher prices and margins. We think its diversified, value-added portfolio is well positioned to capitalize on secular growth trends across its end markets.
-
TE Connectivity Ltd. (TEL) – TEL was a top performer as it is benefiting from AI spending plus delivering stronger margins despite a mixed demand environment in other end markets. Its diversified portfolio, high-value products, and market leadership, combined with disciplined capital allocation through dividends and buybacks, position it for sustained growth and margin expansion.
-
Philip Morris International Inc. (PM) – PM has been a top name this year, fueled by strong growth in its smoke-free portfolio, particularly IQOS and ZYN, alongside the non-discretionary demand for its combustible products and minimal tariff exposure. The stable combustibles business and robust smoke-free growth will drive significant, sustainable free cash flow over the long term.
Top 3 Detractors from Relative Performance
-
Air Products and Chemicals, Inc. (APD) – APD has been a bottom contributor this year as the new CEO addresses prior missteps and value-destructive clean energy projects, which are temporarily dragging on profits. These initiatives are de-risking the business and setting it on a path to higher structural profitability. We’re encouraged by the expected end to free cash flow losses after this year and a more astute capital allocation policy, while the core industrial gas business remains stable.
-
Paychex, Inc. (PAYX) – PAYX has been a bottom performer this year as sentiment softened around the Paycor integration and a weaker labor environment, which pressured organic growth. Despite this, revenue trends are improving, guidance was raised, and cash flow generation remains strong. The Paycor-driven synergies will be an added benefit. We continue to view PAYX as a high-quality, cash-generative business with pricing power and an attractive capital allocation philosophy.
-
Fidelity National Information Services (FIS) – FIS shares underperformed due to inconsistent execution and a weak outlook, implying a delayed acceleration. While we value their strong market position and recurring revenue, the ongoing business transformation introduces execution risk. Given these factors and our existing financial sector exposure, we sold the position to fund higher-conviction ideas in the portfolio.
Sector Influence
We are bottom-up stock pickers, but sector exposures influenced relative performance as follows:
-
What Helped: Overweight Information Technology (a better performing sector) & underweight Health Care (a weaker performing sector)
-
What Hurt: Underweight Communication Services (the best performing sector) & overweight Industrials* (a better performing sector)
*Due to the timing of trades in this sector, the portfolio was underweight Industrials for the majority of 2025, but ended the year overweight.
Portfolio Characteristics & Positioning
We believe the Income Equity portfolio is positioned for long-term durability and possesses the fundamental ingredients that stand the test of time: wide moats, sustainably high returns on capital, strong free cash flow generation, low leverage ratios, and an attractive shareholder yield (dividends + net buybacks). The portfolio trades at a premium to the Value index, but we believe this is justified as companies in the Value indices have lower returns on capital and higher leverage. As a corporate debt maturity wall approaches and the cost of that capital stays elevated, we believe companies with strong balance sheets and the ability to self-fund their operations could have a structural advantage in 2026 and beyond. In an environment of possibly lower returns and greater volatility, we believe the Income Equity portfolio offers an attractive option for equity investors.
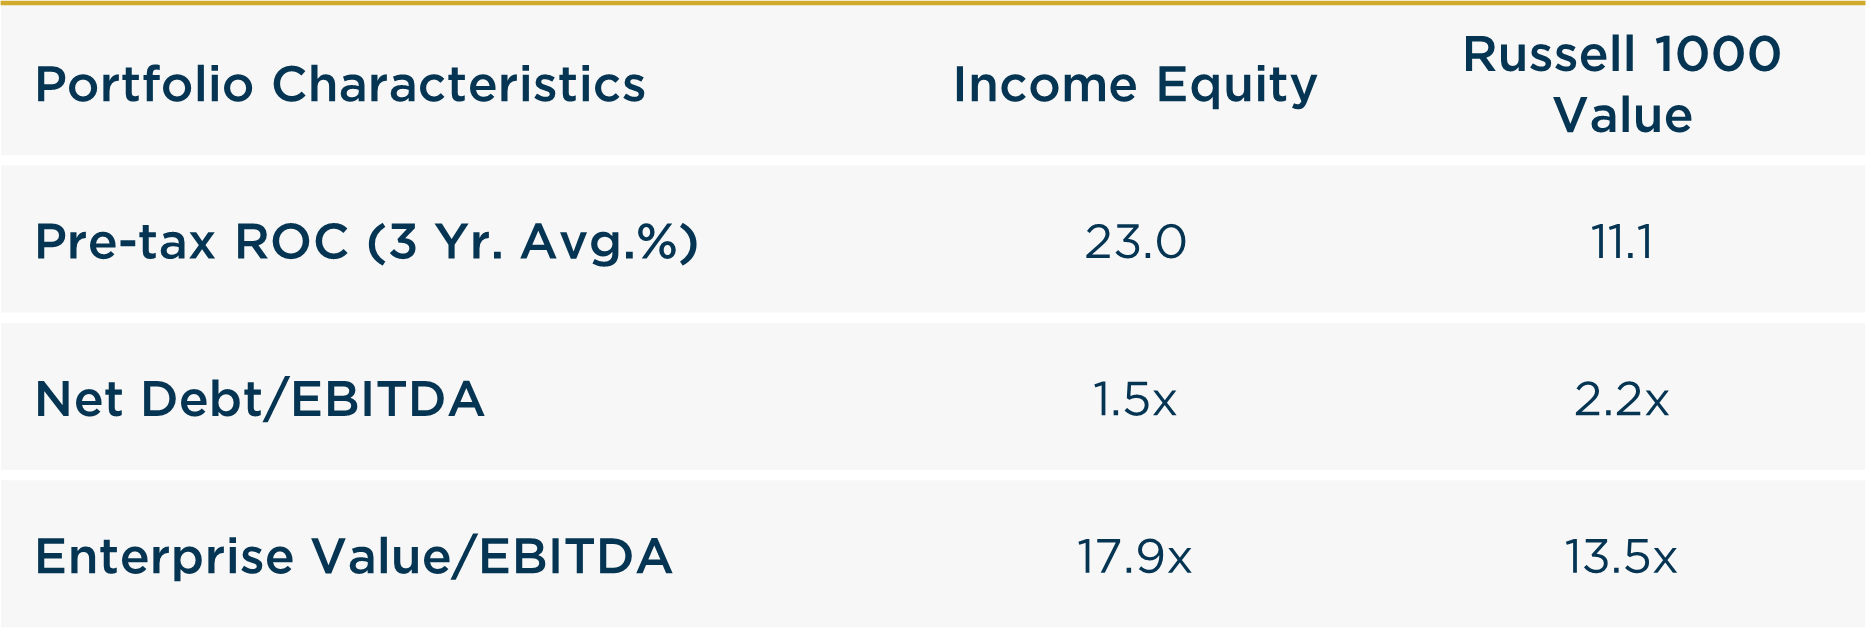
Source: FactSet
Looking Ahead
As we move into 2026, the economic and policy backdrop remains characterized by a mix of support and uncertainty. On the positive side, corporate earnings trends have remained better than expected, consumer activity has shown resilience, and ongoing Fed rate cuts combined with fiscal stimulus measures may continue to support growth. At the same time, late-cycle dynamics are becoming more evident. Labor market softening, affordability pressures, and persistent housing weakness underscore the uneven nature of growth. Trade and tariff policy remain fluid, and elevated complacency leaves markets vulnerable to adverse surprises. Against this backdrop, economic and inflation data may remain volatile, increasing the likelihood of episodic market dislocations. Despite resilient earnings trends and elevated hyperscaler capital spending, we believe caution is prudent given these crosscurrents.
From an equity market perspective, strong headline returns have masked growing dispersion beneath the surface. Leadership has remained narrow and valuation risk increasingly concentrated, raising the possibility that company-specific risks could take on broader significance. Periodic risk-on rallies, particularly among high-beta and lower-quality segments, have contributed meaningfully to recent performance, but history suggests such episodes are rarely durable. We believe the environment is becoming more conducive to broader leadership and a return to fundamentals, where earnings growth, dividends, and balance-sheet strength matter more than valuation multiple expansion. As volatility rises, downside protection is likely to be driven by companies with high and stable returns on invested capital, conservative leverage, and reasonable valuations. Our portfolios remain anchored in these attributes, which we believe offer a more resilient path through shifting market regimes and help clients participate in long-term wealth creation while managing downside risk.
Annualized Returns
As of 12/31/2025
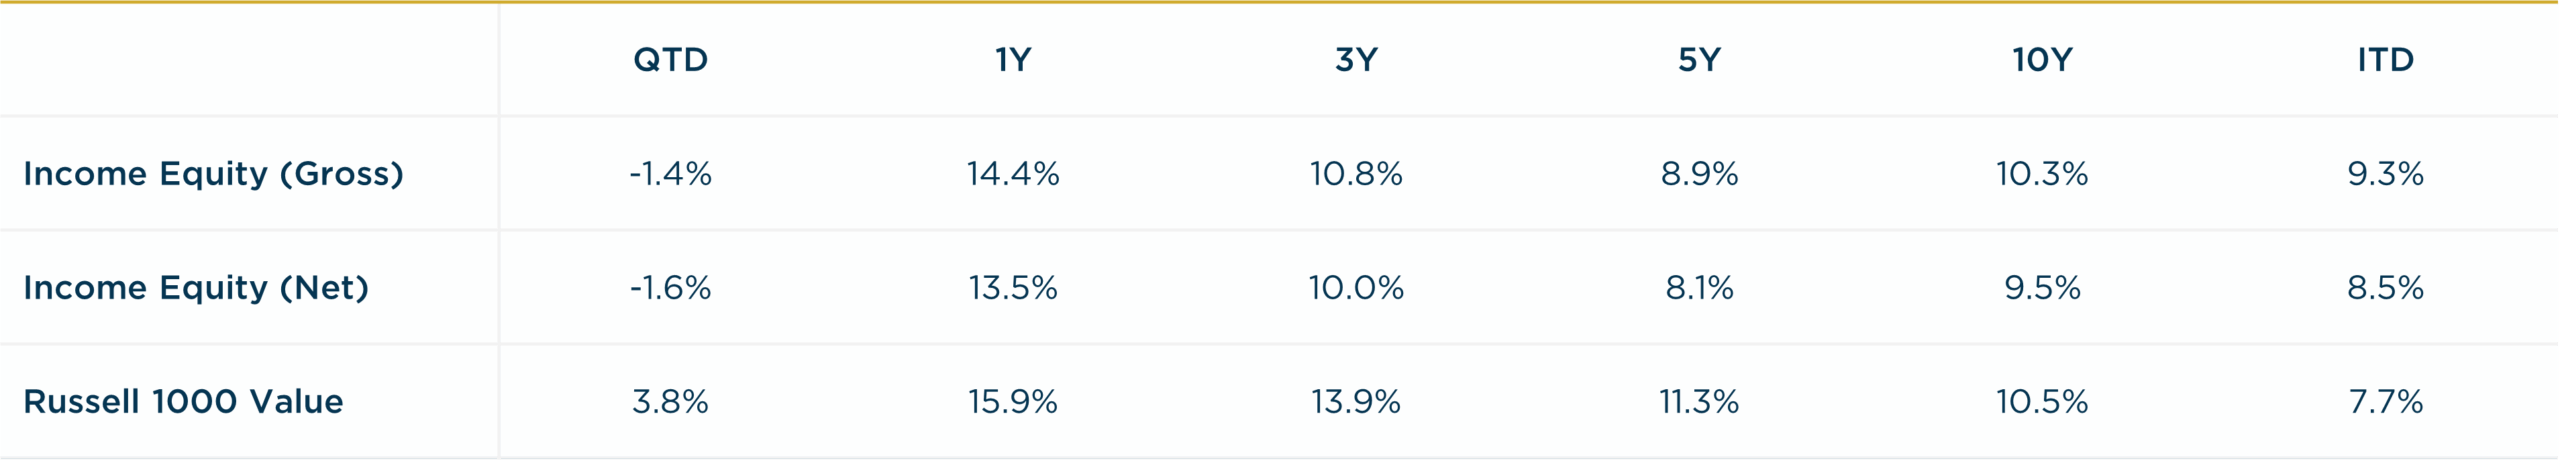
Inception date: 12/31/1999. Performance is preliminary. Subject to change. Past performance should not be taken as a guarantee of future results. Net of fee returns are calculated net of an annual model management fee of 0.75%. Please see the disclosure notes found on the bottom of the page.