Market Observations & Portfolio Commentary
Large Cap – 2024 vs. R1000V
Full Year Market Update
U.S. equities posted another strong year of performance in 2024, in almost a carbon copy of 2023’s robust gains. An easing of macro risks (lower inflation and a weakening labor market), a shift at the Federal Reserve to less restrictive monetary policy, and a late-year election bump drove market gains. And like last year, there was a wide dichotomy in leadership as the market favored larger cap growth over smaller cap value. While equity markets delivered strong headline gains in 2024, these returns were largely driven by multiple expansion, leaving valuations elevated and the market increasingly reliant on a handful of mega-cap leaders. Looking at market factors, Growth, Volatility, Size, and Momentum factors had the most positive impact on relative returns, while Value, Yield, and most of the Quality factors presented headwinds.
Key Performance Takeaways for the Year
-
The London Company Large Cap portfolio returned 15.8% (15.3% net) year-to-date vs. a 14.4% increase in the Russell 1000 Value Index. Sector exposure was a tailwind, partially offset by modestly negative stock selection.
-
For the year, the Large Cap portfolio outperformed the Russell 1000 Value and exceeded our 85-90% upside participation expectations. Being overweight Financials (the best performing sector) and underweight Health Care (the worst performing sector) provided a strong tailwind. Relative performance was further aided by our exposure to two of the Magnificent 7 companies, which were dominant yet again in a narrow, concentrated market.
-
We continue to believe that Quality factors will add value over full cycles. Our focus on high returns on capital, balance sheet strength, and valuation helps to reinforce our margin of safety and positions our Large Cap portfolio for success in this uncertain climate.
Top 3 Contributors to Relative Performance
-
Progressive Corporation (PGR) – PGR outperformed during the year due to its success in growing the business and improving margins. The company has gained market share from competitors and improved its margins by effectively segmenting underwriting risks and implementing strategic pricing. PGR has achieved its profitability target by lowering advertising costs and focusing on acquiring preferred customers. We remain confident in PGR’s ability to execute in all environments, competitive advantages, and capital allocation strategy.
-
Alphabet Inc. (GOOG) – GOOG was a top performer this year after rebounding in the fourth quarter as earnings were better than expected, and investors got some clarity on the antitrust lawsuits. The core ad business remains with margin enhancements and Cloud growth has been a positive. Several new AI features are enhancing Search and AI solutions driving Cloud adoption. Management has executed its expense control plans, and margins have expanded through better product and process organization. GOOG has a solid balance sheet, significant market share, and generates strong returns on invested capital.
-
Fiserv, Inc. (FI) – FI shares outperformed during the year largely driven by strength in the Merchant Solutions segment, particularly the Clover payments platform. New wins and increased penetration of Clover’s value-added services fueled growth, while the macro environment enabled stable consumer spending. The Financial Solutions segment has also performed well, supported by customer account growth and cross-selling efforts. FI has proven to be a steady compounder that provides a balanced mix of revenue stability and diversified growth. We are confident in the company’s ability to generate sustainable earnings growth through its robust product portfolio and disciplined capital allocation.
Top 3 Detractors from Relative Performance
-
Nestle S.A. (NSRGY) – Shares of NSRGY underperformed YTD. Sentiment across the packaged food space is negative as it emerges from two years of unprecedented food price inflation (not seen since the 1970s). High prices pressured volumes and margins industry-wide, and caused consumers to trade-down to value and private label. We view NSRGY as attractively positioned in categories that have stable, long-term volume tailwinds such as coffee, pet food, and nutritional health. We believe the stock can re-rate as volume-led growth returns, and the company continues to execute against profitability and operational goals. We think the new CEO is equipped with a deep knowledge of the company, and will be focused on nurturing and growing the current portfolio of brands.
-
Albemarle Corporation (ALB) – Shares of ALB underperformed, as lithium prices remained weak. The stock hit our soft stop-loss, and we elected to sell the position earlier in the year due to increasing concern about the long-term supply outlook.
-
Old Dominion Freight Line, Inc. (ODFL) – Shares of ODFL are roughly flat YTD, lagging the rally in the broader market. Freight has been challenging in recent months, but results from ODFL reflect share gains and modest volume growth. The company continues to invest in the business with service being the key to gaining market share. ODFL is the best in class LTL operator with EBIT margins in the 27% range. We trimmed the position in the Large Cap portfolio in early 2Q24 due to valuation concerns.
Sector Influence
We are bottom-up stock pickers, but sector exposures influenced relative performance as follows:
-
What Helped: Underweight Health Care (a weaker performing sector) & overweight Financials (a better performing sector)
-
What Hurt: Overweight Materials & Cons. Discretionary (two weaker performing sectors)
Portfolio Characteristics & Positioning
We believe the Large Cap portfolio is positioned for long-term durability and possesses the fundamental ingredients that stand the test of time: wide moats, sustainably high returns on capital, strong free cash flow generation, low leverage ratios, and an attractive shareholder yield (dividends + net buybacks). The portfolio trades at a premium to the Value index, but we believe this is justified as companies in the Value indices have lower returns on capital and higher leverage. As a corporate debt maturity wall approaches and the cost of that capital stays elevated, we believe companies with strong balance sheets and the ability to self-fund their operations could have a structural advantage in 2025 and beyond. In an environment of possibly lower returns and greater volatility, we believe the Large Cap portfolio offers an attractive option for equity investors.
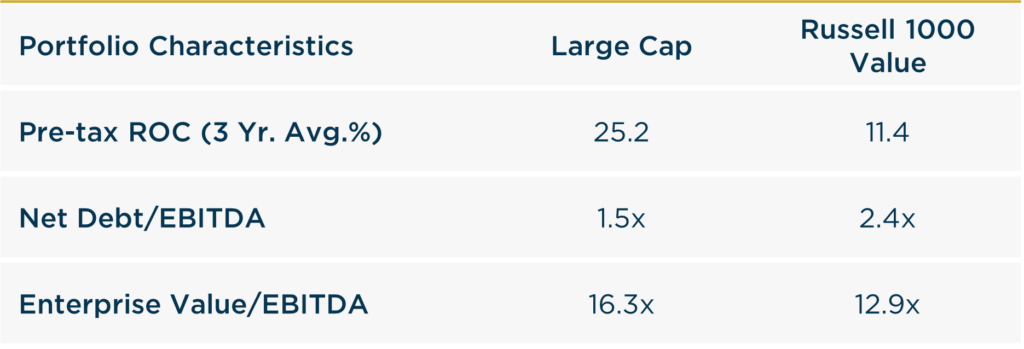
Source: FactSet
Looking Ahead
As we enter 2025, we believe the market faces an inflection point where sustaining momentum becomes increasingly difficult. Across the real economy, demand still seems sluggish and clear late-cycle signals persist. Revenue growth and corporate profits have leaned on inflationary pricing, but margins face growing headwinds as inflationary pricing fades, input costs rise, and demand softens. The Fed cut rates during 2024, but the yields on longer-dated treasuries actually rose as the year ended. Stubbornly high borrowing costs continue to plague rate-sensitive areas of the economy, like housing. Employment and inflation data may be volatile in 2025 and could affect changes in monetary policy and lead to greater volatility across equity markets.
Despite resilient economic data and limited signs of credit risk, we believe vigilance is warranted. Our cautious posture persists due to high valuations, market concentration, looming debt challenges, and fraying consumer health. We anticipate lower expected returns in the near term, based on slowing growth (function of restrictive monetary policy) and high valuations. Valuation multiple expansion can only take the market so far (particularly late in a market cycle). We expect a reversion to the mean whereby earnings growth & dividends drive returns going forward. While optimism remains high, the vulnerabilities of momentum-driven leadership highlight the need for discipline. Markets may reward risk-taking in the short term, but lasting wealth is built through patience, real income, and fundamentals.
We believe the Large Cap portfolio is positioned for long-term durability and possesses the fundamental ingredients that stand the test of time.
Annualized Returns
As of 12/31/2024
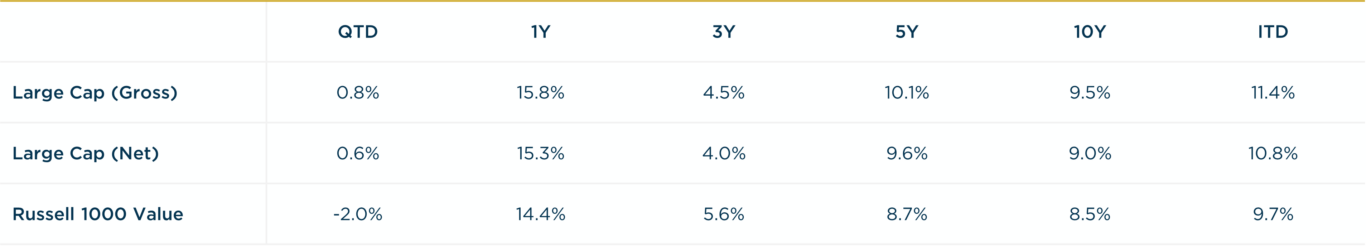
Inception date: 6/30/1994. Past performance should not be taken as a guarantee of future results. Performance is preliminary. Subject to change.
The Large Cap product is typically compared to the Russell 1000 Index. Any comparison to the Russell 1000 Value, or its corresponding ETFs, is for illustrative purposes only.