Market Observations & Portfolio Commentary
Large Cap – 2025 vs. R1000V
Full Year Market Update
U.S. equities posted strong gains in 2025, marking a third consecutive year of double-digit returns, with the Russell 3000 Index rising 17.2%. The year was shaped by robust earnings growth, continued AI enthusiasm driving technology leadership, and incrementally more supportive monetary policy. However, the market navigated significant volatility, particularly during the spring tariff uncertainty when the S&P 500 fell nearly 19% before recovering. The Federal Reserve reduced rates by 75 basis points in the second half of the year, responding to moderating growth and signs of labor market softening while inflation remained above target. Trade policy uncertainty and tariff developments contributed to periodic volatility, though markets generally proved resilient as implementation timelines shifted.
Like recent years, equity market leadership was again concentrated in Large Cap Growth companies, particularly within technology-oriented areas tied to artificial intelligence, as the equal-weight S&P 500 meaningfully trailed its cap-weighted counterpart. Stylistically, Growth led Value for the year, and Large Caps outperformed Small Caps. Sector performance was mixed, with cyclical leadership led by Communication Services, Technology, and Industrials, while more defensive areas lagged. Among market factors, Growth, Volatility, and Size factors posted the strongest relative returns. Momentum also helped. The Quality and Yield factors were large headwinds. The Value factor was mixed.
Key Performance Takeaways for the Year
-
The London Company Large Cap portfolio returned 9.1% (8.3% net) year-to-date vs. a 15.9% increase in the Russell 1000 Value Index. Stock selection was a headwind to relative performance, partially offset by positive sector exposure.
-
For the year, the Large Cap portfolio underperformed the Value benchmark and came up short of our 85-90% upside participation expectations. Despite outperforming in 1Q amid the spike in volatility, the Large Cap portfolio didn’t keep pace with the sharp high beta rally off the April 8th lows. Our lack of direct bank exposure also proved to be a headwind for the year overall. Banks re-rated meaningfully higher from a multiple perspective in 2025, which could prove challenging in 2026 if valuations come under pressure. The portfolio benefited from positive sector exposure, but pockets of weakness in several Financial & Industrial holdings were the main drag on relative results in 2025.
-
As markets broaden and fundamentals reassert their importance, we believe high-quality companies trading at reasonable valuations offer a compelling path forward. We believe our Quality-at-a-Reasonable-Price approach may offer participation in market upside while providing the differentiation that may matter most if volatility increases or leadership shifts.
Top 3 Contributors to Relative Performance
-
Alphabet Inc. (GOOG) – GOOG has been a top performer after reporting better than expected results in its ad business, Cloud growth, plus profitability. Growth was broad-based across Search, YouTube, and Cloud, with AI enhancing search utility and monetization while Cloud margins reached new highs. The legal ruling outcome was not as bad as expected. Management continues to execute on its ability to control costs and grow its business. We remain attracted to its scale, conservative balance sheet, and high returns on capital.
-
TE Connectivity Ltd. (TEL) – TEL has been a top performer this year as it is benefiting from AI spending plus delivering stronger margins despite a mixed demand environment in other end markets. Its diversified portfolio, high-value products, and market leadership, combined with disciplined capital allocation through dividends and buybacks, position it for sustained growth and margin expansion.
-
Charles Schwab Corporation (SCHW) – SCHW has been a top performer this year, delivering solid quarterly and monthly updates that reflect steady improvement in net new assets and balance sheet stabilization as client cash inflows offset prior money market outflows. With the cash sorting issue and AMTD integration headwinds largely behind it, we see a meaningful runway for asset growth across multiple channels (RIAs, direct indexing, robo-advisory, etc.), supported by attractive incremental margins and capital efficiency. The company’s wide competitive moat, strong management team, and long-term growth outlook remain compelling.
Top 3 Detractors from Relative Performance
-
Fiserv, Inc. (FI) – FI underperformed for the year following weak 3Q results that included a sharp guidance cut and announced management and Board changes, including a new CFO. The stock’s decline reflected a loss of investor confidence in execution and the long-term growth outlook, alongside recognition that a turnaround would require significant reinvestment. Given the magnitude of the reset and reduced conviction in the thesis, we exited the position.
-
Bruker Corporation (BRKR) – BRKR shares lagged this year due to uncertainties over NIH funding and tariffs. The CEO stepped up and bought more shares amid the weakness. Some recent distressed acquisitions have pressured margins, which are temporary. While we remain optimistic about BRKR for its vital role in life sciences research and competitive stance, we had higher conviction in other names and exited the position.
-
Air Products and Chemicals, Inc. (APD) – APD was a bottom contributor as near-term results remain pressured by the new CEO’s efforts to address prior missteps and unwind value-destructive clean energy investments, including decisions around legacy green hydrogen projects. While these actions are weighing on profits in the short term, they are de-risking the business and improving capital discipline. We are encouraged by the expected return to positive free cash flow after this year, supported by a stable core industrial gas business and a clearer path to higher structural profitability.
Sector Influence
We are bottom-up stock pickers, but sector exposures influenced relative performance as follows:
-
What Helped: Underweight Real Estate & Health Care (two weaker performing sectors)
-
What Hurt: Overweight Materials & Consumer Discretionary (two weaker performing sectors)
Portfolio Characteristics & Positioning
We believe the Large Cap portfolio is positioned for long-term durability and possesses the fundamental ingredients that stand the test of time: wide moats, sustainably high returns on capital, strong free cash flow generation, low leverage ratios, and an attractive shareholder yield (dividends + net buybacks). The portfolio trades at a premium to the Value index, but we believe this is justified as companies in the Value indices have lower returns on capital and higher leverage. As a corporate debt maturity wall approaches and the cost of that capital stays elevated, we believe companies with strong balance sheets and the ability to self-fund their operations could have a structural advantage in 2026 and beyond. In an environment of possibly lower returns and greater volatility, we believe the Large Cap portfolio offers an attractive option for equity investors.
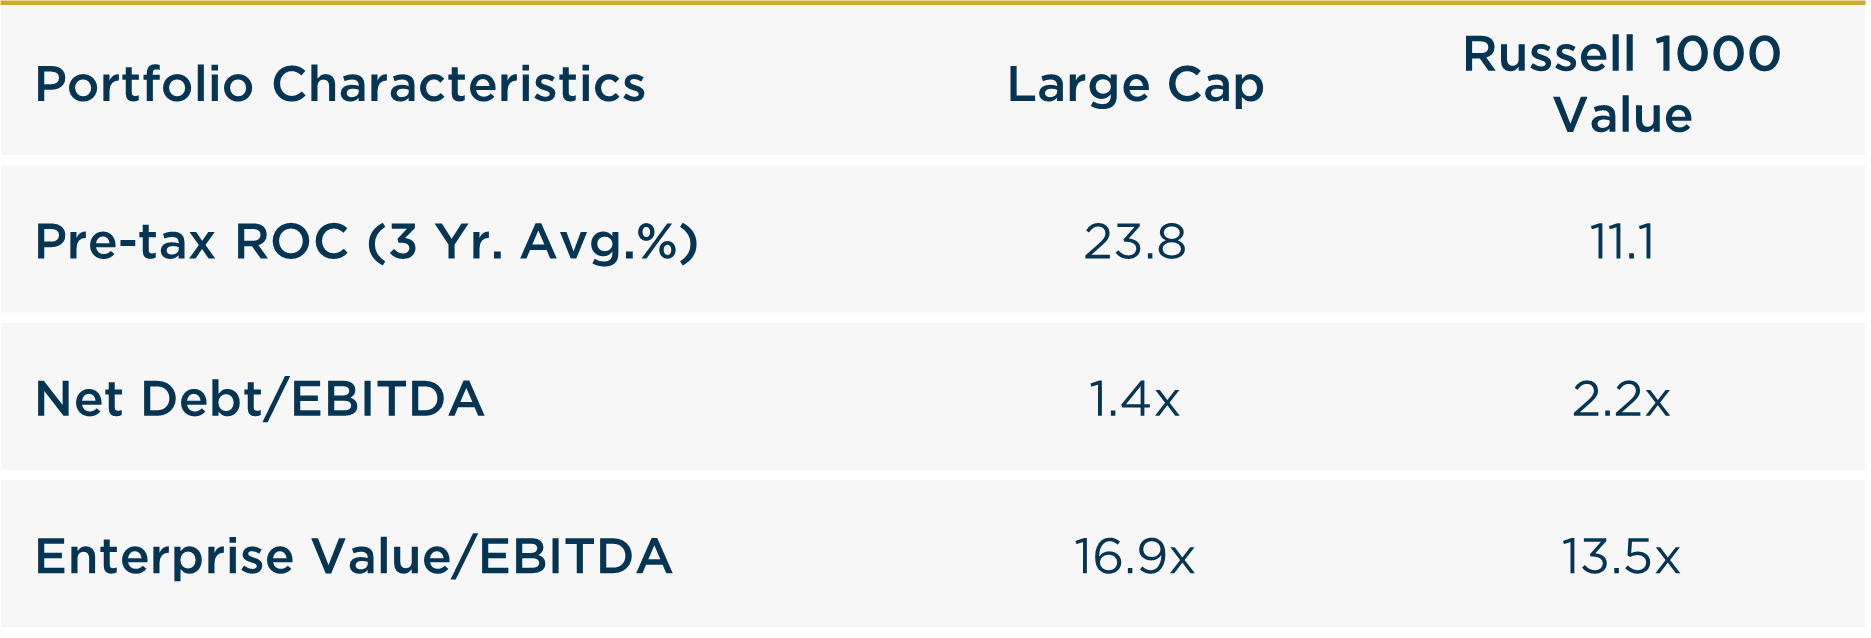
Source: FactSet
Looking Ahead
As we move into 2026, the economic and policy backdrop remains characterized by a mix of support and uncertainty. On the positive side, corporate earnings trends have remained better than expected, consumer activity has shown resilience, and ongoing Fed rate cuts combined with fiscal stimulus measures may continue to support growth. At the same time, late-cycle dynamics are becoming more evident. Labor market softening, affordability pressures, and persistent housing weakness underscore the uneven nature of growth. Trade and tariff policy remain fluid, and elevated complacency leaves markets vulnerable to adverse surprises. Against this backdrop, economic and inflation data may remain volatile, increasing the likelihood of episodic market dislocations. Despite resilient earnings trends and elevated hyperscaler capital spending, we believe caution is prudent given these crosscurrents.
From an equity market perspective, strong headline returns have masked growing dispersion beneath the surface. Leadership has remained narrow and valuation risk increasingly concentrated, raising the possibility that company-specific risks could take on broader significance. Periodic risk-on rallies, particularly among high-beta and lower-quality segments, have contributed meaningfully to recent performance, but history suggests such episodes are rarely durable. We believe the environment is becoming more conducive to broader leadership and a return to fundamentals, where earnings growth, dividends, and balance-sheet strength matter more than valuation multiple expansion. As volatility rises, downside protection is likely to be driven by companies with high and stable returns on invested capital, conservative leverage, and reasonable valuations. Our portfolios remain anchored in these attributes, which we believe offer a more resilient path through shifting market regimes and help clients participate in long-term wealth creation while managing downside risk.
Annualized Returns
As of 12/31/2025

Inception date: 6/30/1994. Performance is preliminary. Subject to change. Past performance should not be taken as a guarantee of future results. Net of fee returns are calculated net of an annual model management fee of 0.75%. Please see the disclosure notes found on the bottom of the page. The Large Cap product is typically compared to the Russell 1000 Index. Any comparison to the Russell 1000 Value is for illustrative purposes only.