Market Observations & Portfolio Commentary
SMID Cap – 2024 vs. R2500
Full Year Market Update
U.S. equities posted another strong year of performance in 2024, in almost a carbon copy of 2023’s robust gains. An easing of macro risks (lower inflation and a weakening labor market), a shift at the Federal Reserve to less restrictive monetary policy, and a late-year election bump drove market gains. And like last year, there was a wide dichotomy in leadership as the market favored larger cap growth over smaller cap value. While equity markets delivered strong headline gains in 2024, these returns were largely driven by multiple expansion, leaving valuations elevated and the market increasingly reliant on a handful of mega-cap leaders. Looking at market factors, Growth, Volatility, Size, and Momentum factors had the most positive impact on relative returns, while Value, Yield, and most of the Quality factors presented headwinds.
Key Performance Takeaways for the Year
-
The London Company Small-Mid Cap portfolio returned 7.4% (6.5% net) year-to-date vs. a 12.0% increase in the Russell 2500 Index. Both sector exposure and stock selection were headwinds to relative performance.
-
Our SMID portfolio produced solid absolute returns, but it trailed its benchmark and came up short of our 85-90% upside participation expectations. Factor headwinds (lack of Growth and Momentum), no exposure to the Utilities sector (the best performing sector), as well as weakness in a few portfolio holdings led to the relative underperformance. While the short-term report card hasn’t been as favorable this year as the prior three, the longer term performance remains strong.
-
Looking ahead, the opportunity down the market cap spectrum is meaningful. Valuations are at historically attractive levels for smaller companies compared to large caps. That said, there is a need to stay up in quality given the elevated rate backdrop, the corporate debt wall maturity approaching, and sluggish demand environment. We believe our SMID portfolio is well positioned to capitalize on attractive relative valuations while avoiding the pitfalls associated with lower-quality, smaller cap companies.
Top 3 Contributors to Relative Performance
-
Deckers Outdoor Corporation (DECK) – DECK’s stock yielded a total return of greater than 80% in 2024. This is now the third straight year that DECK has been a top contributor to the portfolio. DECK manages leading brands in the footwear industry and has outperformed other retailers for several years. UGG and HOKA are benefitting from brand heat, and management remains focused on thoughtfully acquiring and retaining customers. DECK continues to diversify revenue through the robust growth of HOKA, and the expansion of UGG into new categories and functional seasons. The cash balance sheet with no debt provides an additional element of downside protection.
-
Armstrong World Industries, Inc. (AWI) – AWI shares outperformed as the company continues to exhibit strong sales and earnings growth amidst muted market conditions. Markets are beginning to stabilize and should return to low single digit growth, with the recovery led by new construction, renovation, and growth initiatives. Positive trends in transportation, education, healthcare, and data centers gives us confidence that the company will continue to execute.
-
Murphy USA, Inc. (MUSA) – MUSA’s stock performance reflects the business’s ability to compound value over time. Over the past three years, MUSA has profitably taken market share in both the fuel and tobacco categories. These market share wins help drive a virtuous cycle as MUSA reinvests some of those profits back into their leading low-price strategy to drive further market share gains. Management’s favorable capital allocation policies yield attractive shareholder returns.
Top 3 Detractors from Relative Performance
-
Lamb Weston Holdings, Inc. (LW) – LW underperformed the benchmark during the year due to excess industry supply limiting pricing gains, poor execution on its ERP rollout, market share losses, and weak restaurant foot traffic. While there are short-term tailwinds, the long-term industry drivers remain attractive. We remain attracted to LW’s flexible balance sheet, leading market share, capital allocation strategy, and industry tailwinds.
-
Endava Plc (DAVA) – DAVA underperformed the broader markets early in the year reflecting weaker than expected operating results. Management reduced guidance due to weaker client spending, which we attribute to their high concentrations in the payments and financial services verticals. However, the bigger issue was the announced acquisition of GalaxE, an offshore Indian outsourcer. This acquisition is a full pivot from their existing strategy and company identity. Management had assured us previously that they had no intention of going after low-skill projects and that a nearshore orientation is fundamental to their identity. We decided to exit the position when we became aware that we had misjudged management and that the business is fundamentally changing with the announcement of a questionable acquisition.
-
Entegris, Inc. (ENTG) – ENTG lagged during the year with more pronounced weakness in the second half. Management extended the recovery timeline for semiconductors due to sluggish demand in older technologies and the timing of new nodes. That said, ENTG continues to benefit from the higher amount of materials needed for new technologies and is winning business as its products deliver faster time to yield. We remain attracted to the industry’s high barriers to entry, limited competitors, and high switching costs.
Sector Influence
We are bottom-up stock pickers, but sector exposures influenced relative performance as follows:
-
What Helped: Underweight both Health Care & Energy (weaker performing sectors)
-
What Hurt: Underweight in Utilities & Financials (better performing sectors)
Portfolio Characteristics & Positioning
We believe the SMID portfolio is positioned for long-term durability and possesses the fundamental ingredients that stand the test of time: wide moats, sustainably high returns on capital, strong cash flow generation, low leverage ratios, and trading at a reasonable valuation. As a corporate debt maturity wall approaches and the cost of that capital stays elevated, we believe companies with strong balance sheets and the ability to self-fund their operations could have a structural advantage in 2025 and beyond. In an environment of possibly lower returns and greater volatility, we believe the SMID portfolio offers an attractive option for equity investors.
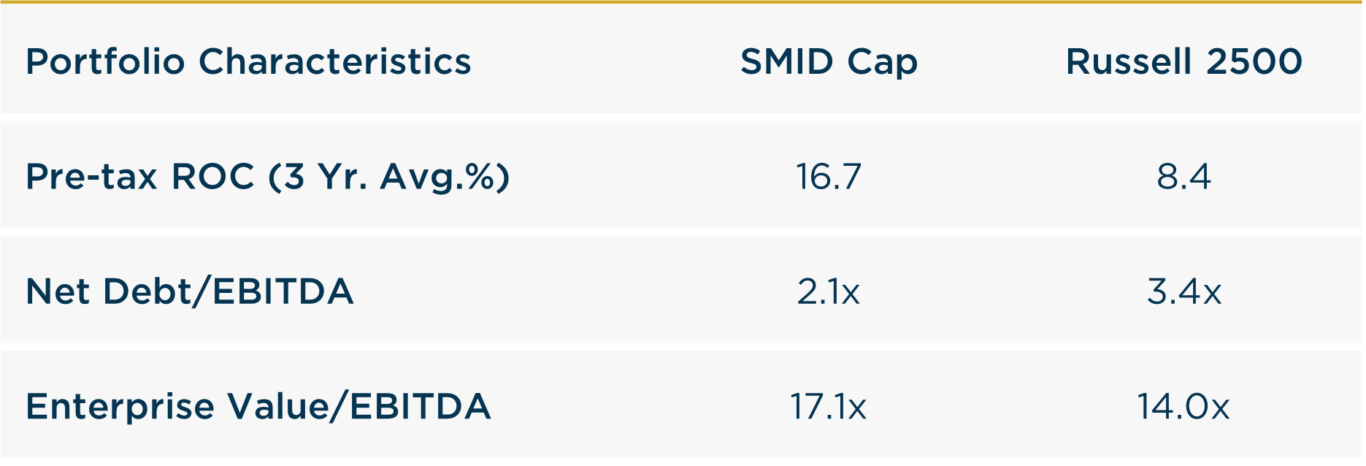
Source: FactSet
Looking Ahead
As we enter 2025, we believe the market faces an inflection point where sustaining momentum becomes increasingly difficult. Across the real economy, demand still seems sluggish and clear late-cycle signals persist. Revenue growth and corporate profits have leaned on inflationary pricing, but margins face growing headwinds as inflationary pricing fades, input costs rise, and demand softens. The Fed cut rates during 2024, but the yields on longer-dated treasuries actually rose as the year ended. Stubbornly high borrowing costs continue to plague rate-sensitive areas of the economy, like housing. Employment and inflation data may be volatile in 2025 and could affect changes in monetary policy and lead to greater volatility across equity markets.
Despite resilient economic data and limited signs of credit risk, we believe vigilance is warranted. Our cautious posture persists due to high valuations, market concentration, looming debt challenges, and fraying consumer health. We anticipate lower expected returns in the near term, based on slowing growth (function of restrictive monetary policy) and high valuations. Valuation multiple expansion can only take the market so far (particularly late in a market cycle). We expect a reversion to the mean whereby earnings growth & dividends drive returns going forward. While optimism remains high, the vulnerabilities of momentum-driven leadership highlight the need for discipline. Markets may reward risk-taking in the short term, but lasting wealth is built through patience, real income, and fundamentals.
We believe the SMID Cap portfolio is positioned for long-term durability and possesses the fundamental ingredients that stand the test of time.
Annualized Returns
As of 12/31/2024
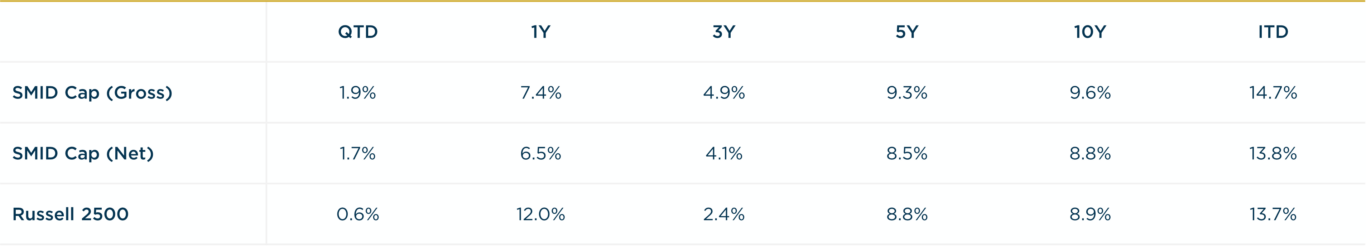
Inception date: 3/31/2009. Past performance should not be taken as a guarantee of future results. Performance is preliminary. Subject to change.