Market Observations & Portfolio Commentary
Income Equity – 2024 vs R1000
Full Year Market Update
U.S. equities posted another strong year of performance in 2024, in almost a carbon copy of 2023’s robust gains. An easing of macro risks (lower inflation and a weakening labor market), a shift at the Federal Reserve to less restrictive monetary policy, and a late-year election bump drove market gains. And like last year, there was a wide dichotomy in leadership as the market favored larger cap growth over smaller cap value. While equity markets delivered strong headline gains in 2024, these returns were largely driven by multiple expansion, leaving valuations elevated and the market increasingly reliant on a handful of mega-cap leaders. Looking at market factors, Growth, Volatility, Size, and Momentum factors had the most positive impact on relative returns, while Value, Yield, and most of the Quality factors presented headwinds.
Key Performance Takeaways for the Year
-
The London Company Income Equity portfolio returned 12.3% (11.9% net) year-to-date vs. a 24.5% increase in the Russell 1000 index. Both sector allocation and stock selection were headwinds to relative performance.
-
The Income Equity portfolio trailed the Russell 1000 in 2024, falling short of our goal of 85-90% upside participation in a rising market. Similar to 2023, robust returns were driven by narrow mega-cap leadership and Momentum & Growth factors, which was not aligned with our focus on Quality, Value, and Yield. However, the portfolio gained ground in the second half, particularly in Q3, as broader market participation and increased volatility aligned with our strengths.
-
Equity markets delivered strong gains in 2024, but these were largely driven by multiple expansion, leaving valuations stretched and performance reliant on a few mega-cap leaders. With concentrated momentum likely unsustainable, near-term equity returns may be modest. We anticipate a return to fundamentals, where earnings growth and dividends drive total returns. By emphasizing quality, income, and valuation, the Income Equity portfolio is well-positioned for success in this expensive and concentrated market.
Top 3 Contributors to Relative Performance
-
Progressive Corporation (PGR) – PGR outperformed during the year due to its success in growing the business and improving margins. PGR has gained market share from competitors and improved its margins by effectively segmenting underwriting risks and implementing strategic pricing. PGR has achieved its profitability target by lowering advertising costs and focusing on acquiring preferred customers. We remain confident in PGR’s ability to execute in all environments, competitive advantages, and capital allocation strategy.
-
Fidelity National Information Services (FIS) – FIS shares outperformed during the year as management executed on its turnaround plan to drive profitable growth while remaining disciplined with capital allocation. FIS sold its majority ownership stake in the merchant solutions business earlier in the year, which enabled greater financial flexibility and operational focus. Quarterly results continue to exceed expectations with a promising medium-term outlook for growth and margin expansion. Management remains committed to strengthening the balance sheet and returning capital to shareholders as they regain credibility with investors. We are attracted to FIS’s durable business model as it maintains a leadership position across its core segments and provides mission critical services to its customers.
-
Cincinnati Financial Corporation (CINF) – Shares of CINF rebounded in 2024 reflecting improving margins across most of its business. The Property & Casualty industry performed well during the year, with few exceptions. While we continue to carefully monitor the reserve situation in casualty lines at CINF and at their peers, we continue to like CINF for their underwriting discipline and agent-focused strategy.
Top 3 Detractors from Relative Performance
-
Nestle S.A. (NSRGY) – NSRGY shares underperformed the broader market all year. Sentiment across the packaged food space is weak as we emerge from two years of unprecedented food price inflation. NSRGY’s latest earnings report did not suggest an acceleration in organic growth from current subdued trends. NSRGY’s portfolio is attractively positioned in categories that have stable, long-term volume tailwinds such as coffee, pet food, and nutritional health. Barring further executional missteps, we believe the downside to the current stock price is low.
-
United Parcel Service, Inc. (UPS) – UPS underperformed this year due to the challenging transportation and parcel market. Many foreign economies have been weak in recent months and economic growth in the U.S. has shifted to services from goods (negative for shipping companies). Weaker revenue growth along with higher union contract wages led to lower margins. While recent results have been lackluster, we maintain our confidence in the long-term growth opportunities in the global package delivery business. The dividend yield is roughly 5% and management continues to return cash to shareholders via dividends and share repurchase at attractive prices.
-
Crown Castle, Inc. (CCI) – CCI underperformed this year due to higher leverage, slower carrier spending, and the timing of its strategic review. Additional weakness stemmed from expectations of slower interest rate cuts in 2025. The core tower business continues to report strong numbers and data usage growth has been the highest in history. CCI benefits from long-term leases and a new management team focused on improving the returns on capital. We like CCI’s stable revenue stream and long-term tailwinds on growth in data consumption. CCI offers an attractive double-digit return through its 6% dividend yield that grows at 7-8% over the long term.
Sector Influence
We are bottom-up stock pickers, but sector exposures influenced relative performance as follows:
-
What Helped: Overweight Financials (a better performing sector) & underweight Health Care (a weaker performing sector)
-
What Hurt: Underweight Info. Technology (a better performing sector) & overweight Materials (a weaker performing sector)
Portfolio Characteristics & Positioning
We believe the Income Equity portfolio is positioned for long-term durability and possesses the fundamental ingredients that stand the test of time: wide moats, sustainably high returns on capital, strong cash flow generation, low leverage ratios, a premium shareholder yield (dividends + net buybacks), and trading at an attractive discount to the Russell 1000. As a corporate debt maturity wall approaches and the cost of that capital stays elevated, we believe companies with strong balance sheets and the ability to self-fund their operations could have a structural advantage in 2025 and beyond. In an environment of possibly lower returns and greater volatility, we believe the Income Equity portfolio offers an attractive option for equity investors.
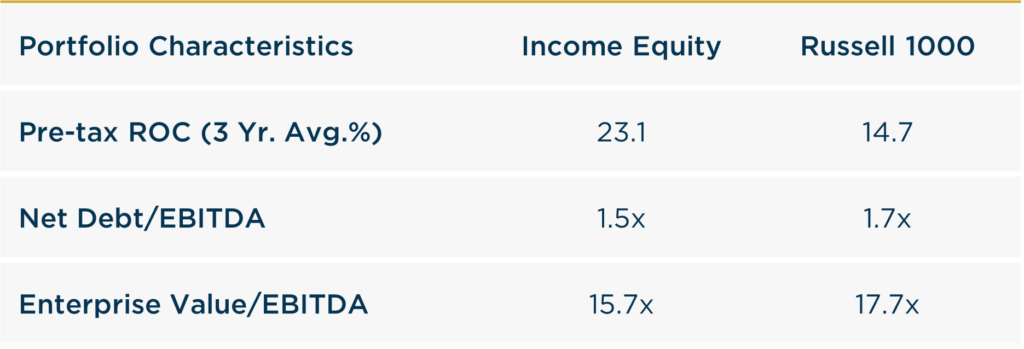
Source: FactSet
Looking Ahead
As we enter 2025, we believe the market faces an inflection point where sustaining momentum becomes increasingly difficult. Across the real economy, demand still seems sluggish and clear late-cycle signals persist. Revenue growth and corporate profits have leaned on inflationary pricing, but margins face growing headwinds as inflationary pricing fades, input costs rise, and demand softens. The Fed cut rates during 2024, but the yields on longer-dated treasuries actually rose as the year ended. Stubbornly high borrowing costs continue to plague rate-sensitive areas of the economy, like housing. Employment and inflation data may be volatile in 2025 and could affect changes in monetary policy and lead to greater volatility across equity markets.
Despite resilient economic data and limited signs of credit risk, we believe vigilance is warranted. Our cautious posture persists due to high valuations, market concentration, looming debt challenges, and fraying consumer health. We anticipate lower expected returns in the near term, based on slowing growth (function of restrictive monetary policy) and high valuations. Valuation multiple expansion can only take the market so far (particularly late in a market cycle). We expect a reversion to the mean whereby earnings growth & dividends drive returns going forward. While optimism remains high, the vulnerabilities of momentum-driven leadership highlight the need for discipline. Markets may reward risk-taking in the short term, but lasting wealth is built through patience, real income, and fundamentals.
We believe the Income Equity portfolio is positioned for long-term durability and possesses the fundamental ingredients that stand the test of time.
Annualized Returns
As of 12/31/2024
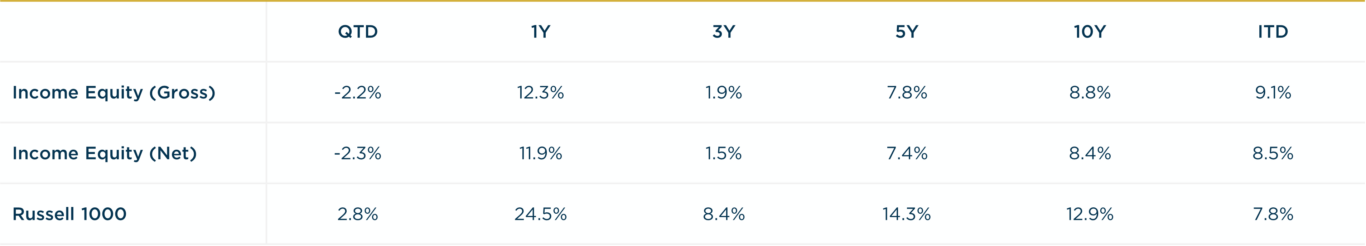
Inception date: 12/31/1999. Past performance should not be taken as a guarantee of future results. Performance is preliminary. Subject to change.