Insights from the CIO
Founder, Chairman, and Chief Investment Officer
Investment Takeaways
- The dominance by a handful of mega-cap stocks echoes risks akin to the Tech Bubble, characterized by elevated concentration & valuation risk.
- Market conditions have intensified sequence risk potential—the risk that an ill-timed portfolio decline may deplete savings sooner than planned.
- Narrow markets are fragile markets, and the top heavy nature of the S&P 500 creates an environment prone to volatility and risk reversals.
- If the next decade’s leadership rhymes with history then we may see broader market participation in the years ahead, favoring lower market capitalizations, a quality value orientation, and dividend paying equities.
- We believe active management, with a focus on risk mitigation, is well positioned to help investors weather the challenges posed by sequence risk and increase the potential for long-term financial success.
Perspectives on the Market
As we sit here today, there are tangible risks in the current market backdrop that share parallels with that of the Tech Bubble. Concentration and valuation risk are both elevated today, and these conditions exacerbate sequence risk potential. Sequence risk refers to the order in which investment returns occur, and how an ill-timed portfolio decline may deplete savings sooner than planned. It can significantly impact the long-term success of an investor’s financial plan.
These same risks were prevalent going into 2000, what would become the opening chapter of the Lost Decade for the S&P 500. An important difference today versus 2000 is the prevalence of passive investing. With the S&P 500 historically top-heavy and passive assets at all-time highs, we note that exposure to these risks is considerably elevated.
Concentration & Valuation Risk
The S&P 500’s return this year marks the most concentrated performance by the largest stocks going back 30 years. Returns have been driven mainly by a few mega-cap stocks known as the ‘Magnificent 7’ (Apple, Microsoft, Amazon, NVIDIA, Alphabet, Tesla, & Meta Platforms). These stocks, with an average YTD return of 81% through October, have also become increasingly overvalued. The strength of this group has been supported by the scarcity of growth opportunities and enthusiasm about artificial intelligence (AI). In contrast, non-mega-cap growth areas have struggled, reflecting the higher rate backdrop and concerns over the economy’s trajectory. Mid and Small Cap stock indices are in negative territory through October, and even Large Cap stocks are bifurcated. The spread between the YTD returns for the S&P 500 market cap and equal weight indexes is 13.1%—the 2nd widest positive spread on record. It’s not uncommon for the largest stocks to dominate performance in cap-weighted indices, but when the majority of member stocks are under-performing the overall index, concentration risks become elevated. Following years of such narrow leadership, higher volatility tends to be experienced.
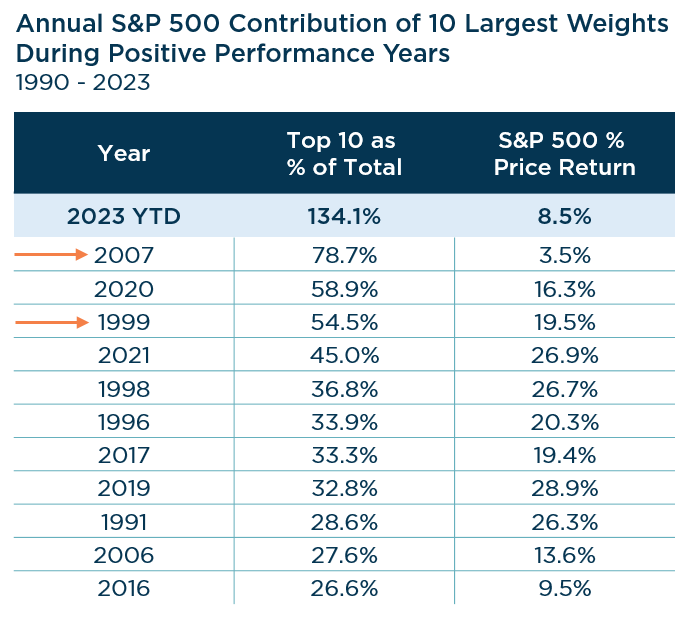
Source: Strategas. Data as of 10/30/2023. Past performance should not be taken as a guarantee of future results.
The strong performance of these mega-cap growth companies has pushed the valuations and index weight of the largest firms to historically high levels. The Top 10 companies now represent about 32% of the index, trading at nearly 27x forward earnings. The skew from this group has pushed the overall index’s valuation to 19x, appearing stretched compared to the long-term historical average of around 15x. Beyond the Top 10, valuations down the market cap spectrum appear more reasonable. Despite rising interest rates, some mega-cap tech companies have maintained elevated valuations due to high growth expectations, largely driven by hype associated with AI. Unfortunately, there’s still plenty of uncertainty with the timing and profitability implications with those developments. If the commercialization of the internet is any guide, it is important to not confuse innovation with value creation. One of the biggest lessons from the Tech Bubble is that overpaying for future growth is costly to investment returns.
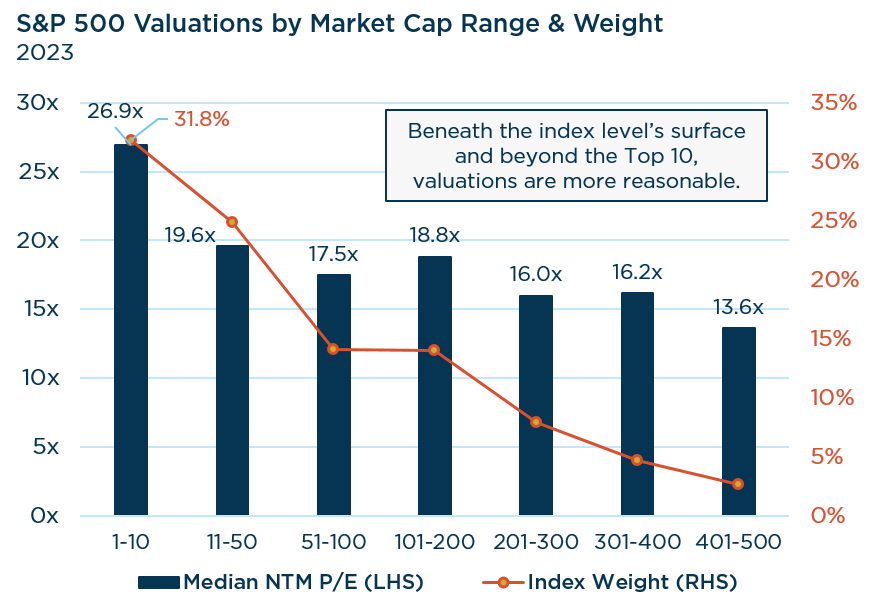
Source: Piper Sandler. Data as of 9/30/2023. Past performance should not be taken as a guarantee of future results.
Sequence Risk: The Hidden Risk
Sequence risk arises when the timing and order of investment returns intersect with the necessity of withdrawing funds from a portfolio. If withdrawals coincide with a decline in asset values, the portfolio may struggle to recover sufficiently to meet future needs. Even though investment returns may average out favorably over the long term, the initial damage done by sequence risk can be daunting to reverse.
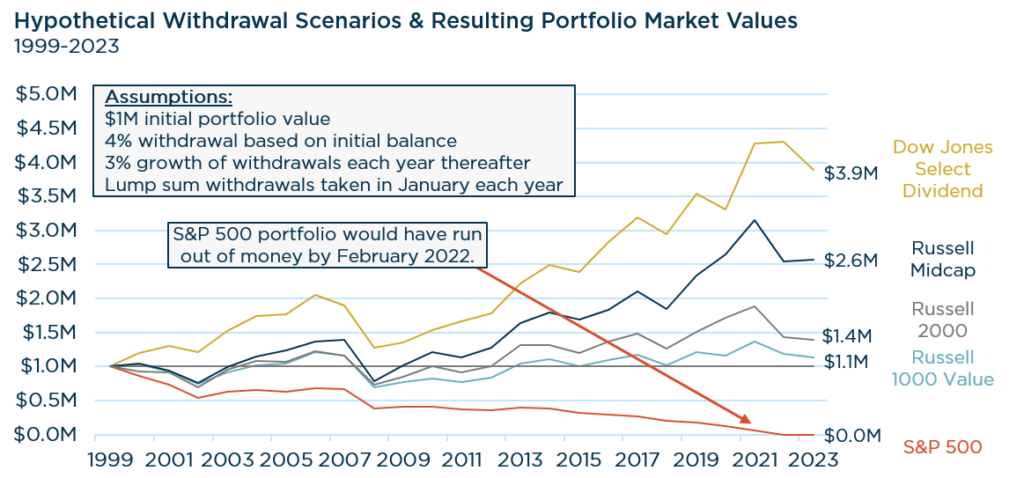
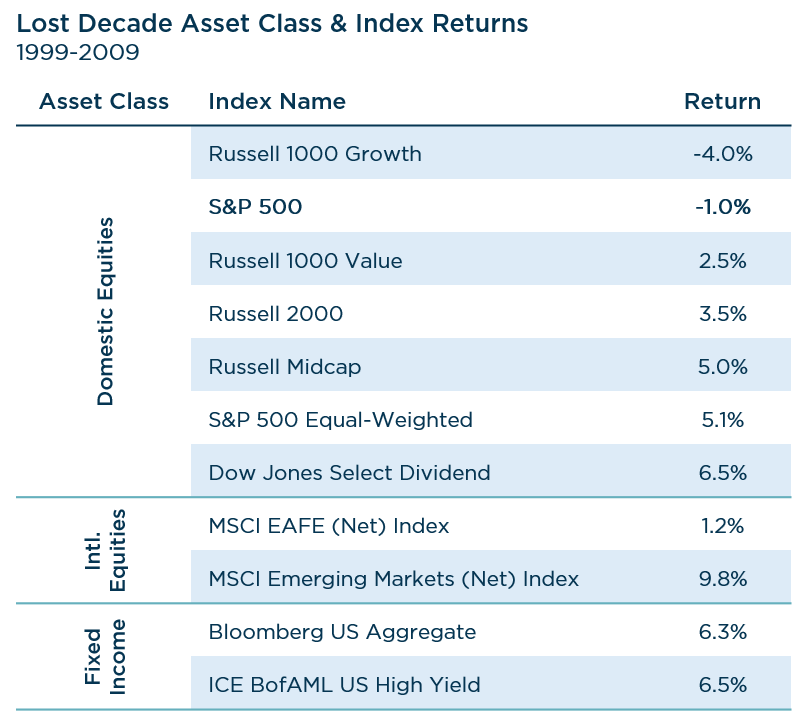
Examining historical instances of elevated concentration and valuation risks, such as the lead-up to the Tech Bubble, provides valuable insights. A hypothetical example using the Bill Bengen “4% rule” illustrates the lasting impact of sequence risk on a retiree’s financial well-being. The rule suggests withdrawing 4% of the initial balance annually, with these distributions growing by 3% yearly to account for inflation. We’ve included the Russell Midcap & Russell 2000 to represent lower market cap companies. We’ve also included the Russell 1000 Value and Dow Jones Select Dividend indices in our scenario to underscore the advantages of a valuation sensitivity and the importance of dividends, respectively.
Considering a hypothetical portfolio with a $1 million initial balance, an investor solely in the S&P 500 would have depleted their funds by 2022. In contrast, the other indices experienced portfolio growth while making annual distributions. On the surface, these results may seem pretty surprising, especially since the S&P 500 has compounded at double-digit returns over the past 10 years. During the Lost Decade (12/31/99-12/31/09), however, the index compounded at -1%. This serves as a compelling example of how a strategic focus on diversification, valuation sensitivity, and dividends can help provide downside protection and enhance the likelihood of outperformance over time.
Sources: Touchstone & Morningstar Direct. Data as of 12/31/99-9/30/23. Past performance should not be taken as a guarantee of future results.
Mitigating Sequence Risk & the Role of Active Management
To effectively mitigate sequence risk, investors should consider diversifying their portfolios across asset classes, tailored to their risk tolerance and financial goals. However, asset allocation can be a double-edged sword. A shift to a more conservative portfolio with less equity exposure, while reducing volatility, may lead to lower expected returns, slower growth, and diminished income streams during retirement. This raises concerns about premature portfolio exhaustion if larger withdrawals are necessary.
Enter active management. Unlike indexing, which thrives in upward-trending markets, active management tends to shine during periods of volatility and negative markets, where risk management is key. The adaptability of active management can help reduce vulnerability to specific risks and respond swiftly to opportunities.
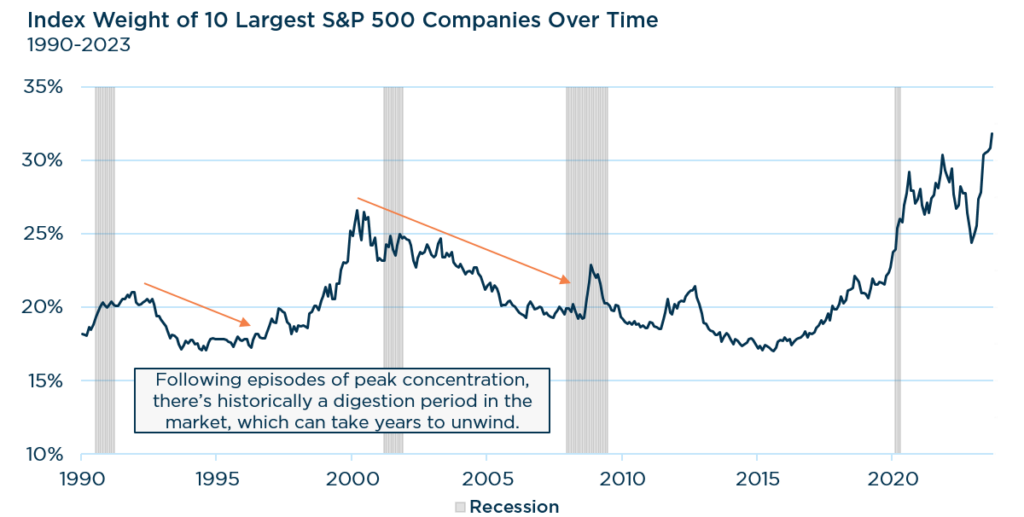
Source: Piper Sandler. Performance from 1/31/90-9/30/23. Past performance should not be taken as a guarantee of future results.
We have experienced high levels of index concentration in the past, and it usually leads to a great time to shift to active management. Just as there are today, there were many great businesses with solid profitability back in the 90s that benefitted from the hope of strong growth driven by the promise of the internet. What many investors may have forgotten about, however, is that you can be right on the business and still be wrong on the investment. We do not need to experience a difficult recession or some shock to the economy for the largest companies to underperform the broader market. Sometimes, growth expectations just get too high and/or valuations become extreme. The Top 10 holdings in the S&P 500 at the end of 1999 were Microsoft, GE, Cisco, Wal-Mart, Exxon, Intel, Lucent, IBM, Citigroup, and AOL. The bubble wasn’t limited to small, unprofitable tech firms.
In Summary
Narrow markets are fragile markets, and the top-heavy nature of the S&P 500 creates an environment prone to volatility and risk reversals. The heightened concentration and valuation risks of the current market, akin to the Tech Bubble era, amplify sequence risk concerns. Maintaining equity exposure is still important and depends on various factors (e.g. time horizon & risk tolerance), but we’re wary of cap-weighted Core & Growth indices. As interest rates remain high and growth likely slows, the valuation of equities may compress, but the expensive mega-cap companies may see the greatest valuation multiple compression.
While we’re not predicting another ‘Lost Decade,’ it’s important to recall the challenges large cap Core & Growth equities faced during 2000-2009. Alternative asset classes and equity styles posted gains during that period. If the next decade’s leadership rhymes with history, then we may see broader market participation in the years ahead. Leadership that favors lower market capitalizations and a quality value orientation. Further, the potential for lower returns emphasizes the growing importance of dividends to total returns.
Given the risks facing the large cap indices, we believe it is an opportune time to consider increasing active management exposure. We believe active management, with a focus on risk mitigation, can assist investors in navigating sequence risk challenges and enhance the potential for long-term financial success.
Source: eVestment. Performance from 12/31/99-12/31/09. Past performance should not be taken as a guarantee of future results
View Our Strategies
See the latest performance data