Market Observations & Portfolio Commentary
Income Equity – 4Q2025 vs Russell 1000 Value
Market Update
U.S. equities finished higher for a third consecutive quarter in Q4, with the Russell 3000 Index rising 2.4% and the S&P 500 posting similar gains. The quarter was supported by strong earnings growth, 50 basis points of additional Fed rate cuts, and an extension of the US-China trade truce. However, headwinds emerged from AI investment scrutiny, labor market softening with unemployment reaching a four-year high of 4.6%, and a prolonged government shutdown. The quarter reflected investors navigating between optimism around earnings strength and concerns about AI returns and macroeconomic softening.
Equity market performance was again characterized by uneven leadership beneath strong headline returns. Performance among the Magnificent 7 companies displayed growing divergence, while the high beta rally that began in April showed signs of exhaustion beginning in November. Stylistically, Value outperformed Growth across the market cap spectrum, but performance between Large and Small Cap equities was more balanced. Sector leadership was mixed. Health Care and Communication Services were the most positive, while the other Defensive sectors (Real Estate, Utilities & Consumer Staples) were negative for the quarter. Looking at market factors, Value factors were the primary driver of returns, led by stocks trading at lower prices relative to sales and book value, while cash-flow-based measures were more muted. Quality factors, which our portfolios tilt toward, were headwinds. Momentum and Volatility factors provided support; meanwhile, Growth & Yield factors were mixed.
Key Performance Takeaways
-
The London Company Income Equity portfolio declined 1.4%
(-1.6% net) during the quarter vs. a 3.8% increase in the Russell 1000 Value Index. Stock selection was as headwind to relative performance, partially offset by positive sector exposure. -
The Income Equity portfolio trailed the Value benchmark in Q4 and came up short of our 85-90% upside capture expectations. Most of the headwind for Q4 was in October, on better CPI data and rate cut expectations. Value and Volatility factors led Quality for the quarter, but Yield factors were particularly weak in October, which weighed on relative and absolute performance for Q4. Our lack of direct bank exposure proved to be a headwind for Q4 and 2025 overall. Banks nearly doubled the index’s overall return for both Q4 and 2025 as the Fed lowered short term interest rates and the yield curve steepened. Banks re-rated meaningfully higher from a multiple perspective in 2025, which could prove challenging in 2026 if valuations come under pressure.
-
Despite a challenging backdrop for Quality, Yield, and Low Volatility exposures, Income Equity finished in line with our 85-90% upside participation expectations for the year.
Top 3 Contributors to Relative Performance
-
Cummins Inc. (CMI) – CMI reported strong results, driven by Power Systems strength tied to data center demand, while the on-highway truck market remains weak. There are some signs that Class 8 deliveries are nearing a bottom. CMI remains one of the few global suppliers capable of supporting large-scale data center backup power requirements. As the market leader in heavy-duty diesel engines, CMI’s diversified business mix, strong competitive positions across its portfolio, and high-margin aftermarket exposure provide a durable foundation for long-term growth.
-
Cisco Systems, Inc. (CSCO) – CSCO was a top performer this quarter following a beat and raise, driven by strong Networking growth and accelerating AI momentum. Strength in core Networking more than offsets near-term weakness in Security, which is transitioning toward a more recurring revenue model. Early signs of a campus refresh cycle were also positive. We think that the company’s leadership position in Networking, product breadth, and balance sheet flexibility will continue to drive growth and shareholder value over time.
-
Corning Inc. (GLW) – Once again, GLW outperformed during the quarter, driven by strong demand in Optical Communications, particularly GenAI-related products. Increasing data speed and bandwidth requirements, both inside and outside data centers, are boosting demand. The uptick in topline has driven meaningful operating leverage. We believe GLW’s diversified portfolio of innovative, value-added products is well-positioned to capitalize on secular growth trends.
Top 3 Detractors from Relative Performance
-
Nintendo Co., Ltd. ADR (NTDOY) – After a strong start, NTDOY was a bottom performer this quarter due to volatility at the beginning of the console cycles and rising cost due to external factors, as the cost of memory chips has increased. All of these are short term rather than any deterioration in the underlying business. The market is underappreciating NTDOY’s evolving platform. There are external offsets to rising costs. We remain attracted to NTDOY’s integrated hardware-software model, brand franchises, and the strength of its balance sheet.
-
Fastenal Company (FAST) – FAST underperformed during the quarter as elevated expectations reset and industrial demand recovered more slowly than expected. Sales growth from new customer sites remained. Strong cash generation, a healthy balance sheet, and disciplined capital allocation continue to provide downside support.
-
BlackRock, Inc. (BLK) – BLK was a bottom performer during the quarter as investor sentiment was pressured by concerns around private market liquidity, return durability, and higher expenses tied to recent acquisitions. Despite this, fundamentals remain solid, with record AUM, healthy flows, and organic base fee growth well above long-term targets, driven by active ETFs, digital assets, and alternatives. We continue to view BLK as a long-term share gainer, and we appreciate the strong balance sheet and steady capital return.
Sector Influence
We are bottom-up stock pickers, but sector exposures influenced relative performance as follows:
-
What Helped: Overweight Information Technology (a better performing sector) & underweight Real Estate (a weaker performing sector)
-
What Hurt: Underweight in both Health Care and Communication Services (better performing sectors)
Trades During the Quarter
-
There were no trades this quarter.
Looking Ahead
As we move into 2026, the economic and policy backdrop remains characterized by a mix of support and uncertainty. On the positive side, corporate earnings trends have remained better than expected, consumer activity has shown resilience, and ongoing Fed rate cuts combined with fiscal stimulus measures may continue to support growth. At the same time, late-cycle dynamics are becoming more evident. Labor market softening, affordability pressures, and persistent housing weakness underscore the uneven nature of growth. Trade and tariff policy remain fluid, and elevated complacency leaves markets vulnerable to adverse surprises. Against this backdrop, economic and inflation data may remain volatile, increasing the likelihood of episodic market dislocations. Despite resilient earnings trends and elevated hyperscaler capital spending, we believe caution is prudent given these crosscurrents.
From an equity market perspective, strong headline returns have masked growing dispersion beneath the surface. Leadership has remained narrow and valuation risk increasingly concentrated, raising the possibility that company-specific risks could take on broader significance. Periodic risk-on rallies, particularly among high-beta and lower-quality segments, have contributed meaningfully to recent performance, but history suggests such episodes are rarely durable. We believe the environment is becoming more conducive to broader leadership and a return to fundamentals, where earnings growth, dividends, and balance-sheet strength matter more than valuation multiple expansion. As volatility rises, downside protection is likely to be driven by companies with high and stable returns on invested capital, conservative leverage, and reasonable valuations. Our portfolios remain anchored in these attributes, which we believe offer a more resilient path through shifting market regimes and help clients participate in long-term wealth creation while managing downside risk.
Annualized Returns
As of 12/31/2025
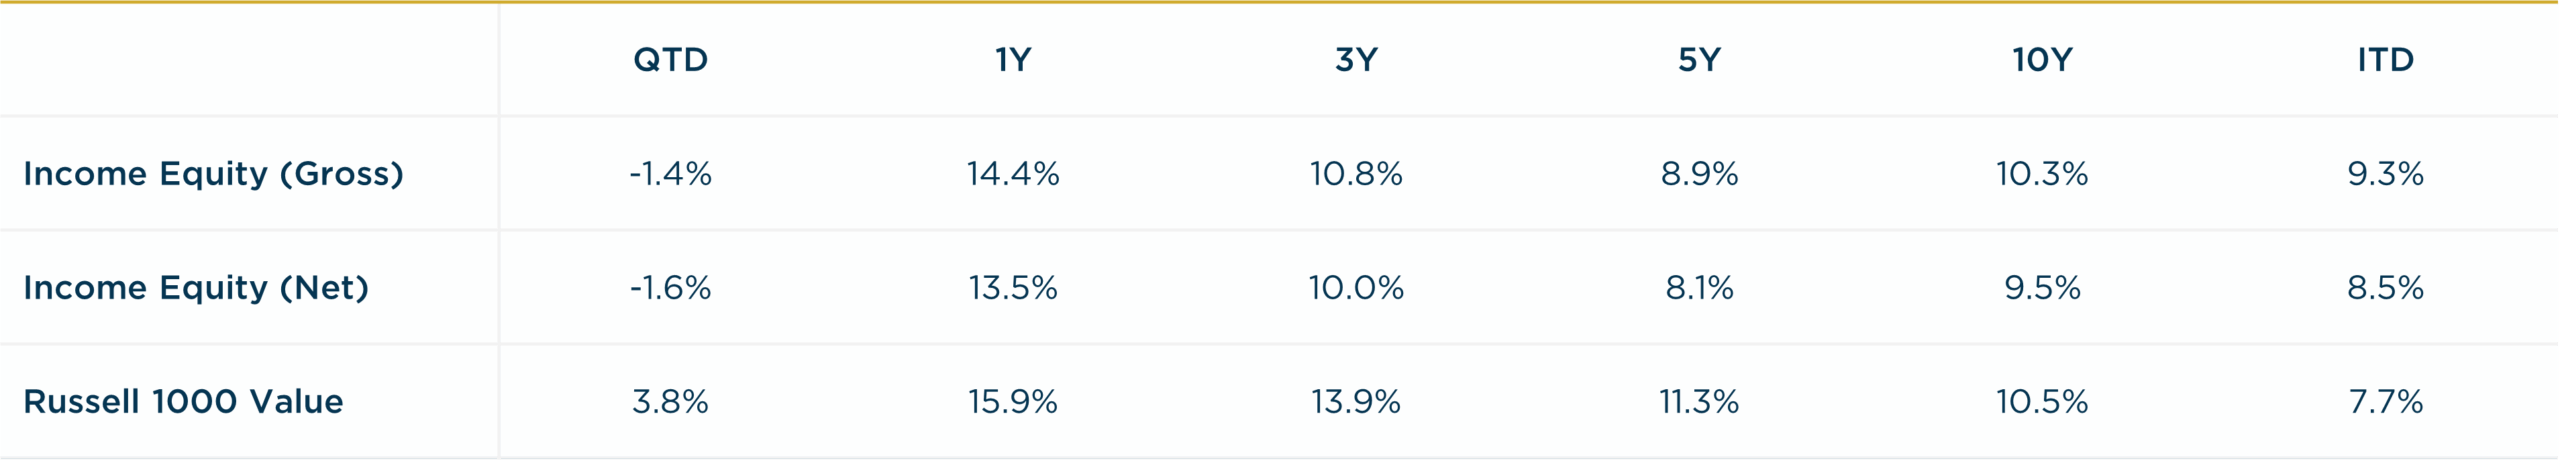
Inception date: 12/31/1999. Performance is preliminary. Subject to change. Past performance should not be taken as a guarantee of future results. Net of fee returns are calculated net of an annual model management fee of 0.75%. Please see the disclosure notes found on the bottom of the page.