Market Observations & Portfolio Commentary
Income Equity – 2Q2025 vs Russell 1000
Market Update
After the significant downturn in the first quarter, U.S. equities experienced a double-digit increase in 2Q. The broader market, as measured by the Russell 3000 Index, increased 11.0%. Volatility surged in early April following new U.S. tariff announcements aimed at reshaping global trade. A double-digit, risk-on rally ensued following a temporary pause in tariff escalations, widespread optimism around enterprise AI, and a healthy earnings outlook. Additionally, improving sentiment, a healthy labor market, and expectations of future Federal Reserve rate cuts further supported the upward momentum, even amidst geopolitical tensions and mixed economic signals. Growth styles led Value, and Large Caps outperformed Small Caps. Turning to market factors, Growth and Volatility posted the strongest returns, and most Momentum factors outperformed. Value and Yield factors had a negative impact, while Quality factors were mixed.
Key Performance Takeaways
-
The London Company Income Equity portfolio returned 4.7% (4.5% net) during the first quarter vs. a 11.1% gain in the Russell 1000 Index. Both sector allocation and stock selection were headwinds to performance.
-
The Income Equity portfolio produced solid absolute returns in 2Q, but relative results came up short of our 85-90% upside capture expectations versus the Russell 1000. The lack of exposure to faster growth and more volatile factors, along with the tilt toward higher quality, higher yielding securities, presented headwinds to relative performance—a complete flip from the 1Q. The concentration of the Index was another contributor to the relative performance headwinds. The Magnificent 7 accounted for roughly 30% of the Index weight and 60% of the 2Q return, and underexposure to this group was a material headwind to relative performance. Given the robust return environment and factor leadership, the strategy performed as we would expect in 2Q, but fortunately our year-to-date results remain comfortably ahead of the Russell 1000 and Russell 1000 Value.
Top 3 Contributors to Relative Performance
-
Nintendo Co., Ltd. ADR (NTDOY) – NTDOY was a top performer driven by excitement surrounding the Switch 2 launch and pre-order demand ahead of management’s base case. This positive momentum aligns with our long-term thesis, reinforcing our confidence in the company’s potential for a highly successful and profitable console cycle.
-
Philip Morris International Inc. (PM) – PM shares outperformed due to strong execution and an improving outlook. The primary driver remains the success of its smoke-free products, with sustained momentum in IQOS and ZYN, supported by robust pricing in the combustibles portfolio. We believe the combination of smoke-free growth potential and a resilient combustibles business will generate significant and sustainable free cash flow in the years ahead.
-
TE Connectivity Ltd. (TEL) – TEL was a top performer after reporting better than expected led by stronger margins and cash flow despite a mixed demand environment. Results were driven by AI momentum in the Industrial segment and a stabilizing Transportation segment. Its diversified portfolio, high-value products, and market leadership, combined with disciplined capital allocation through dividends and buybacks, position it for sustained growth and margin expansion.
Top 3 Detractors from Relative Performance
-
Progressive Corporation (PGR) – PGR was a bottom performer this quarter due to investor concerns over decelerating policy and premium growth, despite strong margins and robust policy expansion driven by its leadership in personal auto insurance. We remain attracted to its best-in-class operations, conservative underwriting, and shareholder-friendly capital allocation philosophy.
-
Air Products and Chemicals, Inc. (APD) – APD was a bottom contributor this quarter as the new leadership addressed past mismanagement in clean energy projects, impacting investor sentiment. The business is now on a path towards de-risking and returning to a higher structural level of profitability. We were encouraged to hear that free cash flow losses are expected to end after this year, and a sharper capital allocation policy is being implemented. The strength and stability of the core industrial gas business remain unchanged.
-
Berkshire Hathaway Inc. Class B (BRK.B) – BRK.B stock underperformed in the quarter as investors favored higher-risk, higher-return opportunities, reversing last quarter’s gains amid a broader flight to safety. Despite this, GEICO’s growth through enhanced underwriting continues to improve the business. We believe the succession plan was well received. We like the company for its diversified operations, conservative underwriting, strong balance sheet, and prudent management team.
Sector Influence
We are bottom-up stock pickers, but sector exposures influenced relative performance as follows:
-
What Helped: Underweight in Health Care (a weaker performing sector) and overweight in Industrials (a better performing sector)
-
What Hurt: Underweight in Information Technology (a better performing sector) and overweight in Consumer Staples (a weaker performing sector)
Trades During the Quarter
-
Initiated: Chubb Limited (CB) – CB engages in the provision of commercial & personal property and casualty insurance, personal accident and accident & health (A&H), reinsurance, and life insurance. Roughly 2/3 of its profits are generated in the U.S. with high-growth Asian markets representing another 20% of earnings. CB has a portfolio of top-performing, multibillion-dollar businesses that have substantial scale and yet potential for growth. CB has a culture of superior underwriting discipline and management has a strong track record of expense control. CB also has a well-balanced mix of business by customer and product, with extensive distribution channels. We believe CB offers investors a rare combination of consistent growth, disciplined underwriting, geographical diversification into high-growth markets, and a well-managed investment portfolio, making it a compelling long-term hold.
-
Increased: Chevron Corporation (CVX), Dominion Energy Inc (D), Corning Inc (GLW), & Norfolk Southern Corporation (NSC) – Added to the existing positions following recent weakness in the shares. There’s no change in the long-term thesis for the businesses.
-
Reduced: Berkshire Hathaway Inc. Class B (BRK.B) & Philip Morris International Inc. (PM) – Trimmed both positions on strength to manage valuation and risks in the portfolio. No change in the long-term thesis for the businesses.
-
Exited: Comcast Corporation (CMCSA) – Sold remaining position due to greater competition from fixed wireless and pressure on the consumer. While we hoped to see this slow as the market reached saturation, pressures on the consumer have only intensified competition.
-
Exited: United Parcel Service, Inc. Class B (UPS) – Sale reflects concerns over a challenging macroeconomic environment combined with the loss of a large customer. This creates a problematic execution story that we believe will be increasingly difficult for UPS to balance. Once we get through this transition period or the economic backdrop clears, we would consider going back into the investment.
Looking Ahead
There is elevated uncertainty as we start the second half of 2025 with a high likelihood of greater tariffs being announced in the weeks ahead. Consumer confidence has declined recently due to the risks of additional tariffs, but the broader economic data still supports growth in the near term, although growth is decelerating. While we are not predicting a recession, the odds of a recession have increased. In terms of monetary policy, the Fed appears to be on a steady course for two or three rate cuts later in the year. The effect of tariffs on both inflation and the broader economy could change those plans, though.
In terms of the equity market, the S&P 500 is back to the expensive, concentrated territory in which it began the year. Meanwhile, the macro risk backdrop has deteriorated since the start of 2025, including labor market softening, ongoing tariff uncertainty, debt headwinds, geopolitical tensions, and unclear inflation trends. Equity returns in the near term may be modest, with shareholder yield (dividends, share repurchases, debt reduction) comprising a significant percentage of the total return from equities. We believe our high-Quality, low-Volatility orientation positions us well for an environment of elevated policy risks and fragile global growth. We remain rooted to our long-term, fundamental investment approach, focusing on company quality, sustainable returns on capital, and resilience across economic scenarios.
Annualized Returns
As of 6/30/2025
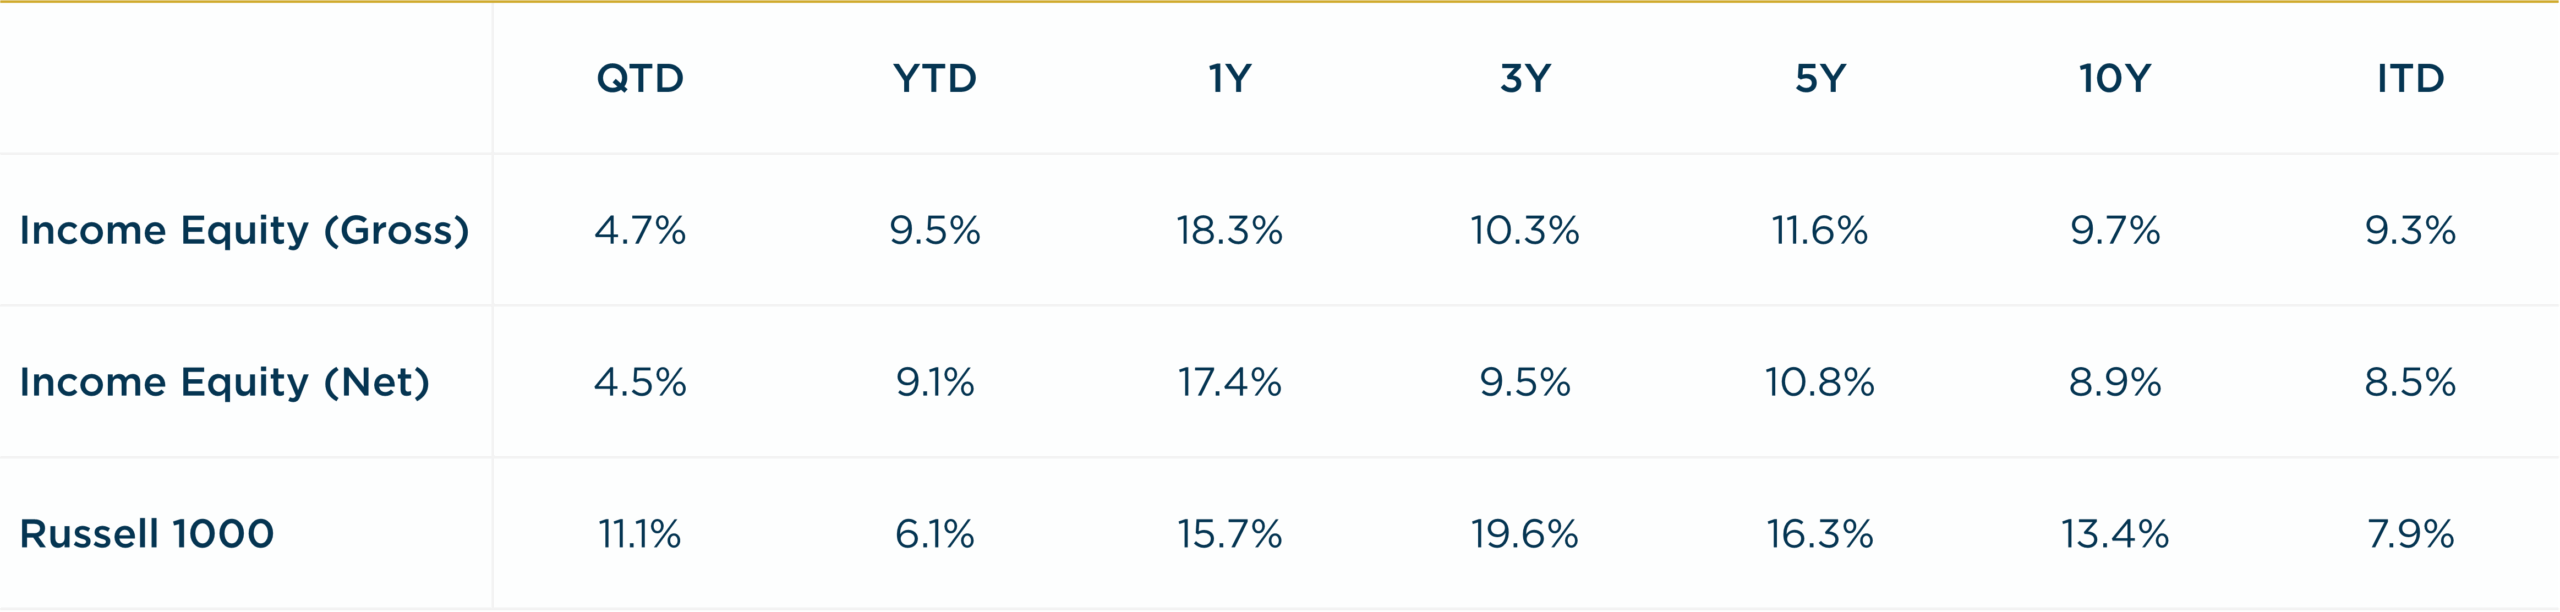
Inception date: 12/31/1999. Performance is preliminary. Subject to change. Past performance should not be taken as a guarantee of future results. Net of fee returns are calculated net of a model management fee of 0.75%. Please see the disclosure notes found on the bottom of the page.