Market Observations & Portfolio Commentary
Large Cap – 2Q2025 vs. Russell 1000
Market Update
After the significant downturn in the first quarter, U.S. equities experienced a double-digit increase in 2Q. The broader market, as measured by the Russell 3000 Index, increased 11.0%. Volatility surged in early April following new U.S. tariff announcements aimed at reshaping global trade. A double-digit, risk-on rally ensued following a temporary pause in tariff escalations, widespread optimism around enterprise AI, and a healthy earnings outlook. Additionally, improving sentiment, a healthy labor market, and expectations of future Federal Reserve rate cuts further supported the upward momentum, even amidst geopolitical tensions and mixed economic signals. Growth styles led Value, and Large Caps outperformed Small Caps. Turning to market factors, Growth and Volatility posted the strongest returns, and most Momentum factors outperformed. Value and Yield factors had a negative impact, while Quality factors were mixed.
Key Performance Takeaways
-
The London Company Large Cap portfolio declined 0.2% during the second quarter (-0.4% net) vs. a 11.1% increase in the Russell 1000 Index. Both stock selection & sector allocation were headwinds to performance.
-
The Large Cap portfolio trailed the Russell 1000 index in 2Q and came up short of our 85-90% upside capture expectations. Our exposure to Lower Volatility and Quality factors flipped from a tailwind in 1Q to a headwind in 2Q, as high beta and momentum driven equities rallied sharply following tariff de-escalation. Index concentration was another factor. The Magnificent 7 accounted for roughly 30% of the Index weight and nearly 60% of the 2Q return, and underexposure to this group was an additional headwind to relative performance. Historically, a reliance on high Quality factors has proven to be a strategy that can lose battles along the way but tends to win the war over time. Fortunes can change quickly with a high conviction portfolio, and we remain confident in the operating metrics of our portfolio companies.
Top 3 Contributors to Relative Performance
-
NewMarket Corporation (NEU) – NEU has been a top performer this year driven by strong AMPAC revenue growth from improved volume and product mix, despite weaker Petroleum Additives performance. Its localized production and sales model provides insulation from tariff impacts. Management continues to focus on paying down debt and returning cash to shareholders through its dividend and buyback.
-
TE Connectivity Ltd. (TEL) – TEL was a top performer after reporting better than expected led by stronger margins and cash flow despite a mixed demand environment. Results were driven by AI momentum in the Industrial segment and a stabilizing Transportation segment. Its diversified portfolio, high-value products, and market leadership, combined with disciplined capital allocation through dividends and buybacks, position it for sustained growth and margin expansion.
-
Charles Schwab Corp (SCHW) – SCHW has been a top name after delivering strong quarterly and monthly results. The results showed steady growth in net new assets and a stabilizing balance sheet, as client cash inflows now effectively offset outflows into money market funds. We continue to like the company’s wide competitive moat and quality management team, as well as long-term growth prospects.
Top 3 Detractors from Relative Performance
-
Fiserv, Inc. (FI) – FI underperformed this year due to concerns about slowdowns in the Clover platform and cautious consumer spending. The news about the CEO’s departure also created uncertainty. Despite Clover’s weaker volume growth, FI’s strong revenue from international expansion, new products, and its resilient Financial Solutions segment continues to remain healthy. We are attracted to FI’s durable business model as it maintains a leadership position across its core segments and provides mission-critical services to its customers.
-
Berkshire Hathaway Inc. Class B (BRK.B) – BRK.B stock underperformed in the quarter as investors favored higher-risk, higher-return opportunities, reversing last quarter’s gains amid a broader flight to safety. Despite this, GEICO’s growth through enhanced underwriting continues to improve the business. We believe the succession plan was well received. We like the company for its diversified operations, conservative underwriting, strong balance sheet, and prudent management team.
-
Progressive Corporation (PGR) – PGR was a bottom performer this quarter due to investor concerns over decelerating policy and premium growth, despite strong margins and robust policy expansion driven by its leadership in personal auto insurance. We remain attracted to its best-in-class operations, conservative underwriting, and shareholder-friendly capital allocation philosophy.
Sector Influence
We are bottom-up stock pickers, but sector exposures influenced relative performance as follows:
-
What Helped: Underweight in both Health Care and Real Estate (weaker performing sectors)
-
What Hurt: Underweight position in Information Technology (better performing sector) and an overweight in Financials (weaker performing sector)
Trades During the Quarter
-
There were no trades during the quarter.
Looking Ahead
There is elevated uncertainty as we start the second half of 2025 with a high likelihood of greater tariffs being announced in the weeks ahead. Consumer confidence has declined recently due to the risks of additional tariffs, but the broader economic data still supports growth in the near term, although growth is decelerating. While we are not predicting a recession, the odds of a recession have increased. In terms of monetary policy, the Fed appears to be on a steady course for two or three rate cuts later in the year. The effect of tariffs on both inflation and the broader economy could change those plans, though.
In terms of the equity market, the S&P 500 is back to the expensive, concentrated territory in which it began the year. Meanwhile, the macro risk backdrop has deteriorated since the start of 2025, including labor market softening, ongoing tariff uncertainty, debt headwinds, geopolitical tensions, and unclear inflation trends. Equity returns in the near term may be modest, with shareholder yield (dividends, share repurchases, debt reduction) comprising a significant percentage of the total return from equities. We believe our high-Quality, low-Volatility orientation positions us well for an environment of elevated policy risks and fragile global growth. We remain rooted to our long-term, fundamental investment approach, focusing on company quality, sustainable returns on capital, and resilience across economic scenarios.
Annualized Returns
As of 6/30/2025
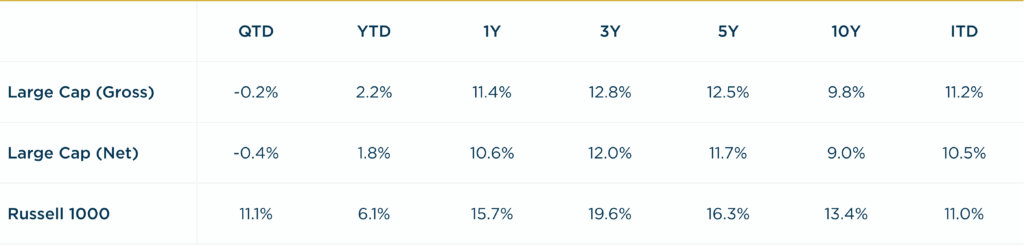
Inception date: 6/30/1994. Performance is preliminary. Subject to change. Past performance should not be taken as a guarantee of future results. Net of fee returns are calculated net of a model management fee of 0.75%. Please see the disclosure notes found on the bottom of the page.