Market Observations & Portfolio Commentary
Small Cap – 2Q2025 vs. Russell 2000
Market Update
After the significant downturn in the first quarter, U.S. equities experienced a double-digit increase in 2Q. The broader market, as measured by the Russell 3000 Index, increased 11.0%. Volatility surged in early April following new U.S. tariff announcements aimed at reshaping global trade. A double-digit, risk-on rally ensued following a temporary pause in tariff escalations, widespread optimism around enterprise AI, and a healthy earnings outlook. Additionally, improving sentiment, a healthy labor market, and expectations of future Federal Reserve rate cuts further supported the upward momentum, even amidst geopolitical tensions and mixed economic signals. Growth styles led Value, and Large Caps outperformed Small Caps. Turning to market factors, Growth and Volatility posted the strongest returns, and most Momentum factors outperformed. Value and Yield factors had a negative impact, while Quality factors were mixed.
Key Performance Takeaways
-
The London Company Small Cap portfolio increased 2.7% (2.4% net) during the quarter vs. an 8.5% increase in the Russell 2000 Index. Sector allocation was a tailwind to relative performance while stock selection was a headwind.
-
The Small Cap portfolio came up short of our 85-90% upside capture expectations in 2Q. Our exposure to Lower Volatility and Quality factors flipped from a tailwind in 1Q to a headwind in 2Q, as high beta and momentum driven rallied sharply following tariff de-escalation. Despite positive sector exposure, pockets of idiosyncratic weakness across several holdings were additional headwinds to relative performance. The recent strength of some of the riskier, more speculative Mid & Small Caps names is not driven by fundamentals nor is it sustainable longer-term.
-
Historically, a reliance on high Quality factors has proven to be a strategy that can lose battles along the way but tends to win the war over time. Fortunes can change quickly with a high conviction portfolio, and we remain confident in the operating metrics of portfolio companies.
Top 3 Contributors to Relative Performance
-
Gates Industrial Corporation Plc (GTES) – GTES was a top performer after delivering a strong quarter, driven by robust automotive replacement demand despite tariff challenges. Management reaffirmed guidance, leveraging pricing power and operational efficiencies to offset tariff costs. The stable replacement channel and margin gains from cost reductions and footprint optimization enhanced performance. We remain attracted to its strong margin profile, and low capital needs continue to drive robust free cash flow. Management’s disciplined capital allocation, balancing buybacks and deleveraging, enhances long-term shareholder value.
-
NewMarket Corporation (NEU) – NEU outperformed this quarter, fueled by strong AMPAC revenue growth from better volume and product mix, despite weaker Petroleum Additives results. The planned capacity expansion for the AMPAC business signals robust demand for rocket additives in a stable, oligopolistic market. Management prioritizes debt reduction and shareholder returns through dividends and buybacks.
-
Armstrong World Industries, Inc. (AWI) – AWI shares outperformed in the quarter due to beating expectations, driven by increased volumes from recent acquisitions and an increase in pricing. We continue to like AWI for its consistent execution, strong financials, leading market share and persistent moats through its exclusivity agreements and warranties.
Top 3 Detractors from Relative Performance
-
ACI Worldwide, Inc. (ACIW) – ACIW was a bottom performer due to investor disappointment over unchanged guidance, despite robust results. The company’s stable business, underpinned by a high proportion of recurring revenues and nearly a year of revenue visibility from its contracted backlog, supports our positive outlook. Sustained organic growth and insider buying by the CEO during the stock pullback reinforce confidence in ACIW’s long-term potential.
-
White Mountains Insurance Group Ltd (WTM) – WTM was a bottom name due to industry headwinds. For U.S. P&C insurers, performance was mundane in 2Q, whereas the rest of the market had a rebound. We remain confident in the company’s ability to deliver outsized growth in book value per share over time through prudent capital allocation.
-
Matson, Inc. (MATX) – MATX was a bottom name due to concerns around tariff-related uncertainties impacting China. Markets that are protected by the Jones Act, which form the majority of its business, remain stable and offer a buffer against tariff-related uncertainties in China. Management is focused on maintaining reliable, on-time shipping, expecting a demand recovery as inventories dwindle.
Sector Influence
We are bottom-up stock pickers, but sector exposures influenced relative performance as follows:
-
What Helped: Underweight in Health Care and Energy (weaker performing sectors)
-
What Hurt: Overweight in Consumer Staples and Real Estate (weaker performing sectors)
Trades During the Quarter
-
Initiated: Interparfums, Inc. (IPAR) – IPAR is a fragrance company offering a portfolio of leading brands via long-term licensing agreements. IPAR has licensing agreements with Montblanc, Jimmy Choo, Coach, Lanvin, Kate Spade, Lacoste, and others. IPAR boasts a net cash balance sheet, founder-led management, and high ROIC. IPAR’s competitive advantages include superior product development and brand equity. We believe IPAR is poised to benefit from growth in the fragrance market, driven by post-COVID consumer behavior shifts, premiumization (higher pricing), and new user penetration. Valuation is attractive (14x EV/EBITDA), reflecting uncertainty around consumer spending.
-
Exited: Cable One, Inc. (CABO) – Sale reflects heightened competitive activity and share losses to fixed wireless access. Our thesis about less competition in rural markets proved to be incorrect. We sold the remaining position following share weakness.
-
Exited: Somnigroup International Inc (SGI) – Sale reflects the rising market cap of the company (formerly Tempur Sealy) following the closing of the Mattress Firm acquisition. At $14B in market cap, SGI was too large for the Small Cap portfolio.
Looking Ahead
There is elevated uncertainty as we start the second half of 2025 with a high likelihood of greater tariffs being announced in the weeks ahead. Consumer confidence has declined recently due to the risks of additional tariffs, but the broader economic data still supports growth in the near term, although growth is decelerating. While we are not predicting a recession, the odds of a recession have increased. In terms of monetary policy, the Fed appears to be on a steady course for two or three rate cuts later in the year. The effect of tariffs on both inflation and the broader economy could change those plans, though.
In terms of the equity market, the S&P 500 is back to the expensive, concentrated territory in which it began the year. Meanwhile, the macro risk backdrop has deteriorated since the start of 2025, including labor market softening, ongoing tariff uncertainty, debt headwinds, geopolitical tensions, and unclear inflation trends. Equity returns in the near term may be modest, with shareholder yield (dividends, share repurchases, debt reduction) comprising a significant percentage of the total return from equities. We believe our high-Quality, low-Volatility orientation positions us well for an environment of elevated policy risks and fragile global growth. We remain rooted to our long-term, fundamental investment approach, focusing on company quality, sustainable returns on capital, and resilience across economic scenarios.
Annualized Returns
As of 6/30/2025
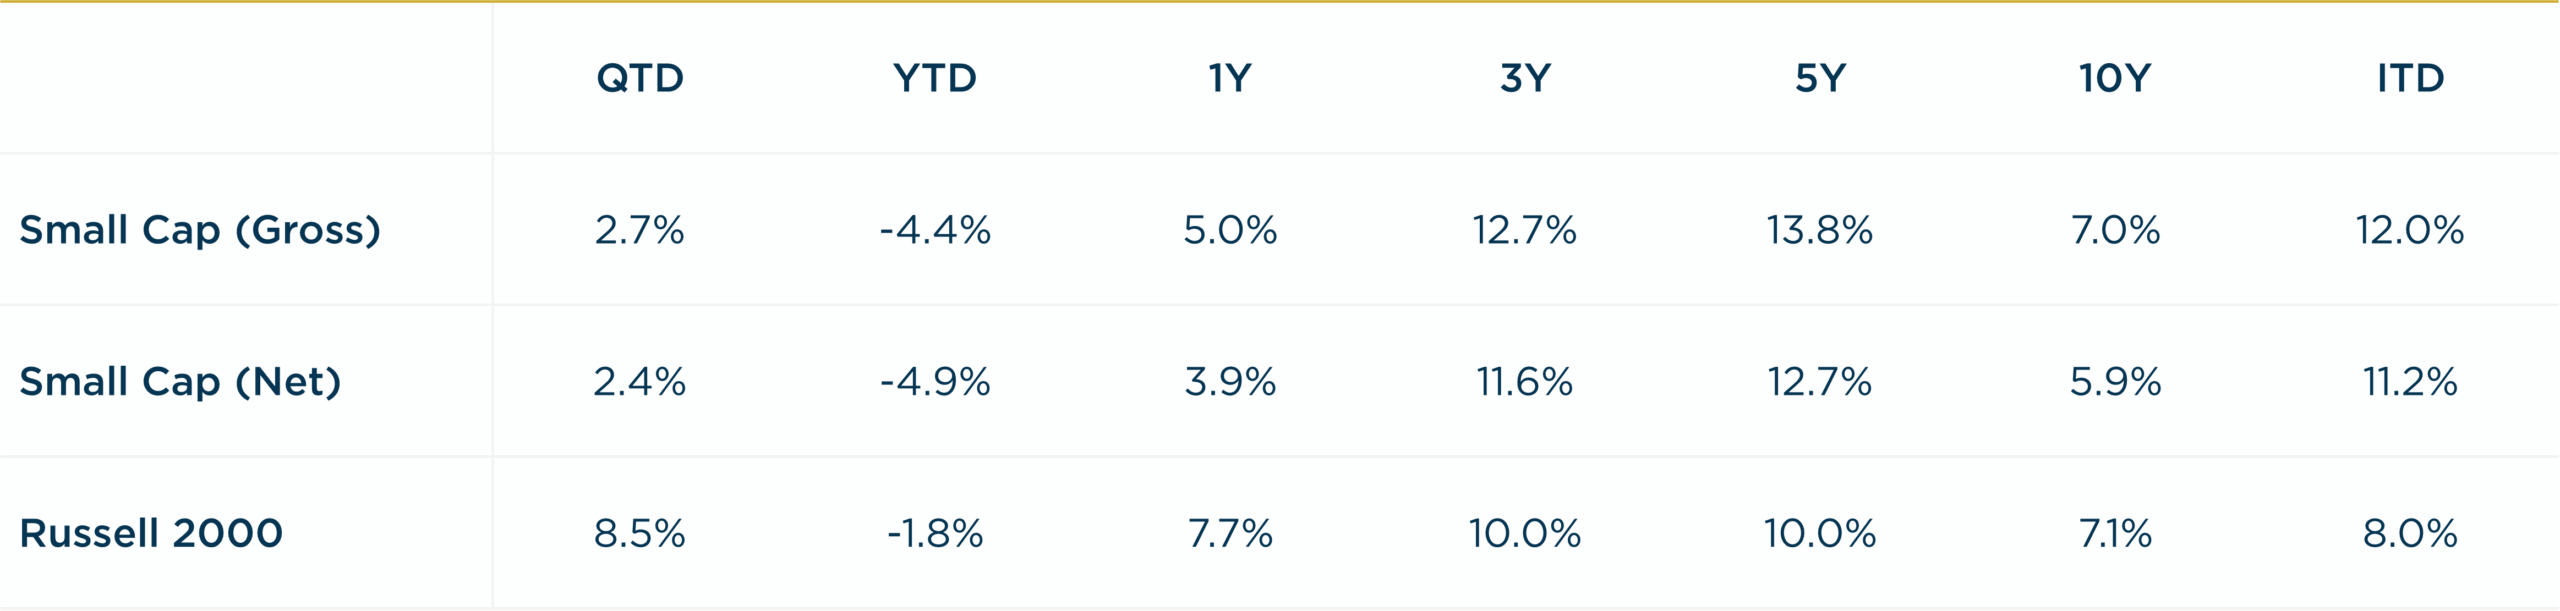
Inception date: 9/30/1999. Performance is preliminary. Subject to change. Past performance should not be taken as a guarantee of future results. Net of fee returns are calculated net of a model management fee of 1.00%. Please see the disclosure notes found on the bottom of the page.