Market Observations & Portfolio Commentary
Small Cap – 3Q2025 vs. Russell 2000
Market Update
U.S. equities continued their advance in Q3, fueled by a Fed rate cut, solid corporate earnings and enthusiasm around AI. Economic data released throughout the third quarter was mixed, but the economy retained most of its momentum from the second quarter. Expectations for additional interest rate cuts by the Federal Reserve also drove more optimism in the market. Volatile, high beta stocks extended their sharp rebound off April 8th lows, notching the strongest high beta rally since the bounce off the Global Financial Crisis trough in 2009. For the quarter, the broader market, as measured by the Russell 3000 Index, increased 8.2%, and the S&P 500 and small-cap Russell 2000 both hit all-time record highs. Stylistically, Growth outperformed Value, and Small Cap stocks led Large Caps. Turning to market factors, Volatility and Yield factors posted the strongest returns. Value and Growth factors were mixed. Quality factors, which our portfolios tilt towards, were mostly headwinds.
Key Performance Takeaways
-
The London Company Small Cap portfolio increased 1.9% gross (1.6% net) during the quarter vs. a 12.4% increase in the Russell 2000 Index. Stock selection was a headwind to relative performance, partially offset by sector exposure.
-
The Small Cap portfolio trailed the benchmark and came up short of our 85-90% upside capture expectations. There have been pockets of idiosyncratic weakness across the Small Cap portfolio, but ultimately our high Quality, low Volatility positioning has been out of favor since April 8th. Quality factors, a tailwind during the drawdown earlier in the year, turned into a headwind as Volatility surged. The high beta rally has been driven by low quality, negative earning companies which have rallied on hopes of further Fed rate cuts. The recent weakness by Quality factors is consistent with historical patterns. In the aftermath of recessions or policy shifts, markets often reward speed and speculation over stability. We remain confident in our holdings: durable advantages, strong balance sheets, and steady free cash flow underpin long-term value.
Top 3 Contributors to Relative Performance
-
Armstrong World Industries, Inc. (AWI) – AWI shares outperformed in the quarter due to beating expectations, driven by better than expected volumes, favorable positioning in key verticals, and strong operating leverage. We continue to like AWI for its consistent execution, strong financials, leading market share and persistent moats through its exclusivity agreements and warranties.
-
Ingevity Corporation (NGVT) – NGVT outperformed its benchmark after showing a significant margin recovery in recent earnings, exceeding low expectations. It cleared major headwinds in its Performance Chemicals segment, fueling y/y gains. The strategic portfolio shifts are driving meaningful profit recovery for the next few years. While much of the business is experiencing a cyclical downturn, the overall mix of revenue is improving, as Performance Materials makes up a larger portion of the pie.
-
Graham Holdings Co. (GHC) – GHC outperformed the benchmark on strong 2Q results, led by solid growth in Kaplan Education and the continued expansion of its Healthcare segment. The stock likely benefited from the perceived easing of broadcast TV M&A regulation, which could enable future station monetization or local consolidation. We remain positive on the GHC family’s fiduciary leadership, strong balance sheet, and track record of returning capital to shareholders.
Top 3 Detractors from Relative Performance
-
Interparfums, Inc. (IPAR) – IPAR was a bottom holding as retailers are managing inventory more cautiously and the overall fragrance market has softened. IPAR brands continue to be resilient with solid growth and incremental share gains. We remain confident in its ability to outgrow its end market through rising adoption and strong execution in innovation plus brand partnerships.
-
Haemonetics Corporation (HAE) – HAE was a bottom performer after reporting a mixed quarter, with the price reaction seemingly extrapolating forward near-term headwinds. Its vascular closure business is facing some elevated competitive pressures due to legacy vendors reacting more aggressively to the perceived threat from its business. However, we believe the company’s portfolio of clinically differentiated, high-margin products will win market share and drive robust earnings growth over time. The thesis relies on minimal improvement in the core segments to drive strong investor returns.
-
White Mountains Insurance Group Ltd (WTM) – WTM was a bottom name due to industry headwinds and investment volatility in its portfolio. Concerns about residuals from early catastrophe hits have also pressured the stock. We remain confident in the company’s ability to deliver outsized growth in book value per share over time through prudent capital allocation.
Sector Influence
We are bottom-up stock pickers, but sector exposures influenced relative performance as follows:
-
What Helped: Overweight Materials & Industrials (two better performing sectors)
-
What Hurt: Overweight Consumer Staples & Real Estate (two weaker performing sectors)
Trades During the Quarter
-
There were no trades during the quarter.
Looking Ahead
Despite the twists and turns of uncertainty, the U.S. economy has displayed impressive resilience this year. Housing, the impact of recent tariffs, and the labor market continue to be areas of concern. That said, the past six months were filled with powerful catalysts—including tax reform, Fed easing, lower long-term rates, tariff clarity, and record capital spending—which gave new life to risk-taking and economic optimism. Still, sticky inflationary pressures combined with a weakening labor market have complicated the Fed’s dual mandate.
Turning to equities, the markets remain concentrated and expensive, potentially limiting room for multiple expansion and raising the prospect of muted returns with higher volatility. Expectations are being partly driven by productivity gains, broadening of earnings growth, and less restricted monetary policy. Yet, the momentum and sustainability of AI and the capex behind it have been questioned more frequently. High beta rallies, like the past 6 months, are rare, short-lived and historically mean-reverting. In the aftermath of recessions or policy shifts, markets often reward speed and speculation over stability. Quality factors usually lag in these circumstances, then regain leadership when fundamentals reassert themselves. With valuations stretched & speculation abundant, we believe focusing on resilient, attractively valued businesses remains the best path to compounding wealth across full cycles. Our Quality-at-a-Reasonable-Price discipline is designed to protect capital during frothy periods and deliver steadier results when the cycle turns.
Annualized Returns
As of 9/30/2025
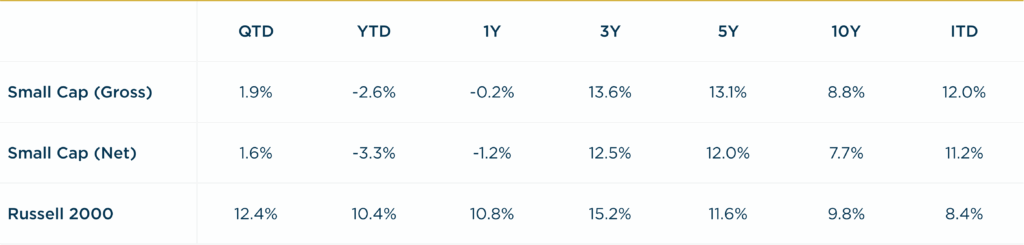
Inception date: 9/30/1999. Performance is preliminary. Subject to change. Past performance should not be taken as a guarantee of future results. Net of fee returns are calculated net of a model management fee of 1.00%. Please see the disclosure notes found on the bottom of the page.