Market Observations & Portfolio Commentary
SMID Cap – 1Q2025 vs. Russell 2500
Market Update
U.S. equities entered correction territory in 1Q25 after notching two robust years of strong gains. Macro risks returned to the forefront of investors’ minds as tariff and austerity uncertainties compounded stubbornly weak economic growth and a return of the inflation specter. Broader market weakness was driven by negative earnings revisions, declining consumer and business confidence, and no change in monetary policy from the Federal Reserve. For the quarter, the broader market, as measured by the Russell 3000 Index, declined 4.7%. A faltering Artificial Intelligence growth narrative allowed for a broadening of market leadership. Value styles led Growth, and Large Caps outperformed Small Caps. Turning to market factors, Value and Yield factors posted the strongest returns. Most of the Quality factors outperformed as well. Growth, Volatility (high beta), and Momentum factors had a negative impact.
Key Performance Takeaways
-
The London Company Small-Mid Cap portfolio declined 6.3% (-6.6% net) during the quarter vs. a 7.5% decrease in the Russell 2500 Index. Relative outperformance was driven by positive stock selection, partially offset by sector exposure headwinds.
-
The SMID portfolio outperformed its benchmark in Q1, but came up short of our 75-80% downside capture expectations. We benefited from our defensive, lower volatility posture, but Quality factors were somewhat mixed during the period. A few idiosyncratic detractors emerged, but we do not see a unifying theme or breakdown. Rather, the quarter was a reflection of a market trying to sort out what matters most in a higher-volatility regime.
Top 3 Contributors to Relative Performance
-
AerCap Holdings (AER) – AER shares performed well this quarter, after reporting solid 4Q24 results. We believe the company is sitting in the enviable position of owning the largest portfolio of aircraft in a seller’s market. The company should be able to continue growing book value per share by selling off certain assets and buying back stock.
-
Hanover Insurance Group, Inc. (THG) – THG outperformed in the quarter due to a strong 4Q24 earnings and 2025 outlook. The thesis is playing out as the company is trending towards high-teens ROE as margins normalize following a flurry of underwriting actions. We like the underwriting-focused culture, niche competitive positioning, and astute management team.
-
Credit Acceptance Corporation (CACC) – CACC’s collection rate declines are stabilizing, with weaker vintages having less impact on the portfolio. Improving trends should support higher revenue and earnings going forward. With disciplined underwriting, dealer expansion, and improving efficiencies, CACC remains resilient and well-positioned for strong performance through the business cycle.
Top 3 Detractors from Relative Performance
-
Churchill Downs Incorporated (CHDN) – CHDN underperformed in the quarter due to weakness in regional gaming and concern about consumer spending. We continue to like CHDN for its highly cash-generative assets, track record of good capital allocation, and opportunities to reinvest in the business at attractive returns.
-
Zebra Technologies Corporation (ZBRA) – ZBRA shares performed poorly this quarter, as the prospects of a significant and unpredictable tariff policy weighed down the name. We believe the company possesses substantial pricing power and that peers are similarly subject to the same threats of tariffs. We continue to like the company for its strong competitive position, long-term growth profile, and high incremental margins.
-
Deckers Outdoor Corporation (DECK) – DECK shares, a top performer in the portfolio over the past three years, faced a challenging quarter sell-off due to concerns over HOKA’s growth rate and elevated expectations. We trimmed our position three times in 2024 to manage its high valuation, but we remain confident in the health and quality of DECK’s footwear brands, management’s long-term focus, and the added downside protection from a debt-free, cash-rich balance sheet.
Sector Influence
We are bottom-up stock pickers, but sector exposures influenced relative performance as follows:
-
What Helped: Overweight position in both Materials and Consumer Staples (two better performing sectors)
-
What Hurt: Underweight position in both Utilities and Energy (two better performing sectors)
Trades During the Quarter
-
Initiated: Saia, Inc. (SAIA) – The company is a leading less-than-truckload (LTL) carrier, providing freight transportation services across the U.S. Operating in a consolidating industry, SAIA is the sixth largest player in the market and has a non-unionized workforce. With some weaker players (Yellow and UPS) out of the market, industry dynamics should improve. SAIA’s strategy emphasizes on-time delivery, low claims, network expansion, and value pricing—helping set it apart. Operating margins are attractive at over 15% and the balance sheet is strong with almost no net debt. We believe SAIA’s outlook is positive, fueled by onshoring trends, ecommerce growth, and industry pricing stability. Its valuation is reasonable, with room for multiple expansion as estimates rise. Downside protection comes from a robust network and premium service levels.
-
Reduced: Broadridge Financial Solutions, Inc. (BR) – Trimmed BR to bring the position size closer to 3% of the portfolio. We remain confident in the long-term dynamics as the company remains the leader in proxy communications.
-
Exited: Cable One, Inc. (CABO) – Sale reflects weak subscriber growth due to less moving activity and competition from fixed wireless. The stock has underperformed in recent years and the position size was less than 1% of the portfolio.
Looking Ahead
There is elevated uncertainty as we start the second quarter with a high likelihood of greater tariffs being announced in the weeks ahead. Consumer confidence has declined recently due to the risks of additional tariffs, but the broader economic data still supports growth in the near term, but growth is decelerating. While we are not predicting a recession, the odds of a recession have increased. In terms of monetary policy, the Fed appears to be on a steady course for two or three rate cuts later in the year. The effect of tariffs on both inflation and the broader economy could change those plans though.
Despite the recent correction, the market concentration and valuations remain elevated. History shows that transitions following peak market concentration (e.g. the Nifty Fifty or the Tech Bubble) tend to play out over multiple years—not quarters. The cap-weighted indices may continue to face pressure as investors reassess stretched valuations and excessive positioning. We believe that equity returns in the near term may be modest, with shareholder yield (dividends, share repurchase, debt reduction) comprising a significant percentage of the total return from equities. Defensive portfolios such as ours should be favored areas for investors if recession concerns remain or materialize. Importantly, Quality factors have historically posted their best relative returns during periods of decelerating growth and through recessions. Quality factors typically lag in the early days of a recovery and keep pace during the mid-cycle years. We may be late in the economic cycle now. If that is correct, it bodes well for the relative performance of Quality factors over the next few years and for our portfolios.
Annualized Returns
As of 3/31/2025
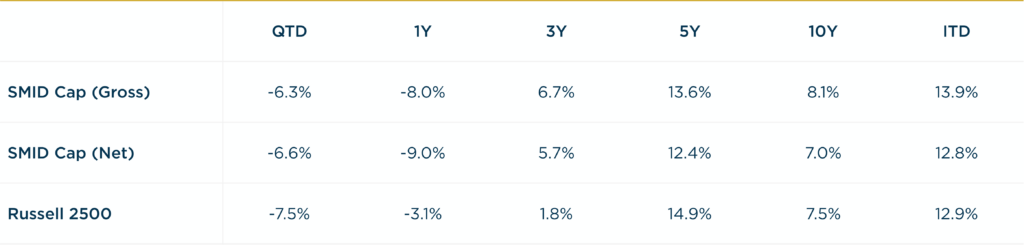
Inception date: 3/31/2009. Performance is preliminary. Subject to change. Past performance should not be taken as a guarantee of future results. Net of fee returns are calculated net of a model management fee of 1.00%. Please see the disclosure notes found on the bottom of the page.