Market Observations & Portfolio Commentary
SMID Cap – 2Q2025 vs. Russell 2500
Market Update
After the significant downturn in the first quarter, U.S. equities experienced a double-digit increase in 2Q. The broader market, as measured by the Russell 3000 Index, increased 11.0%. Volatility surged in early April following new U.S. tariff announcements aimed at reshaping global trade. A double-digit, risk-on rally ensued following a temporary pause in tariff escalations, widespread optimism around enterprise AI, and a healthy earnings outlook. Additionally, improving sentiment, a healthy labor market, and expectations of future Federal Reserve rate cuts further supported the upward momentum, even amidst geopolitical tensions and mixed economic signals. Growth styles led Value, and Large Caps outperformed Small Caps. Turning to market factors, Growth and Volatility posted the strongest returns, and most Momentum factors outperformed. Value and Yield factors had a negative impact, while Quality factors were mixed.
Key Performance Takeaways
-
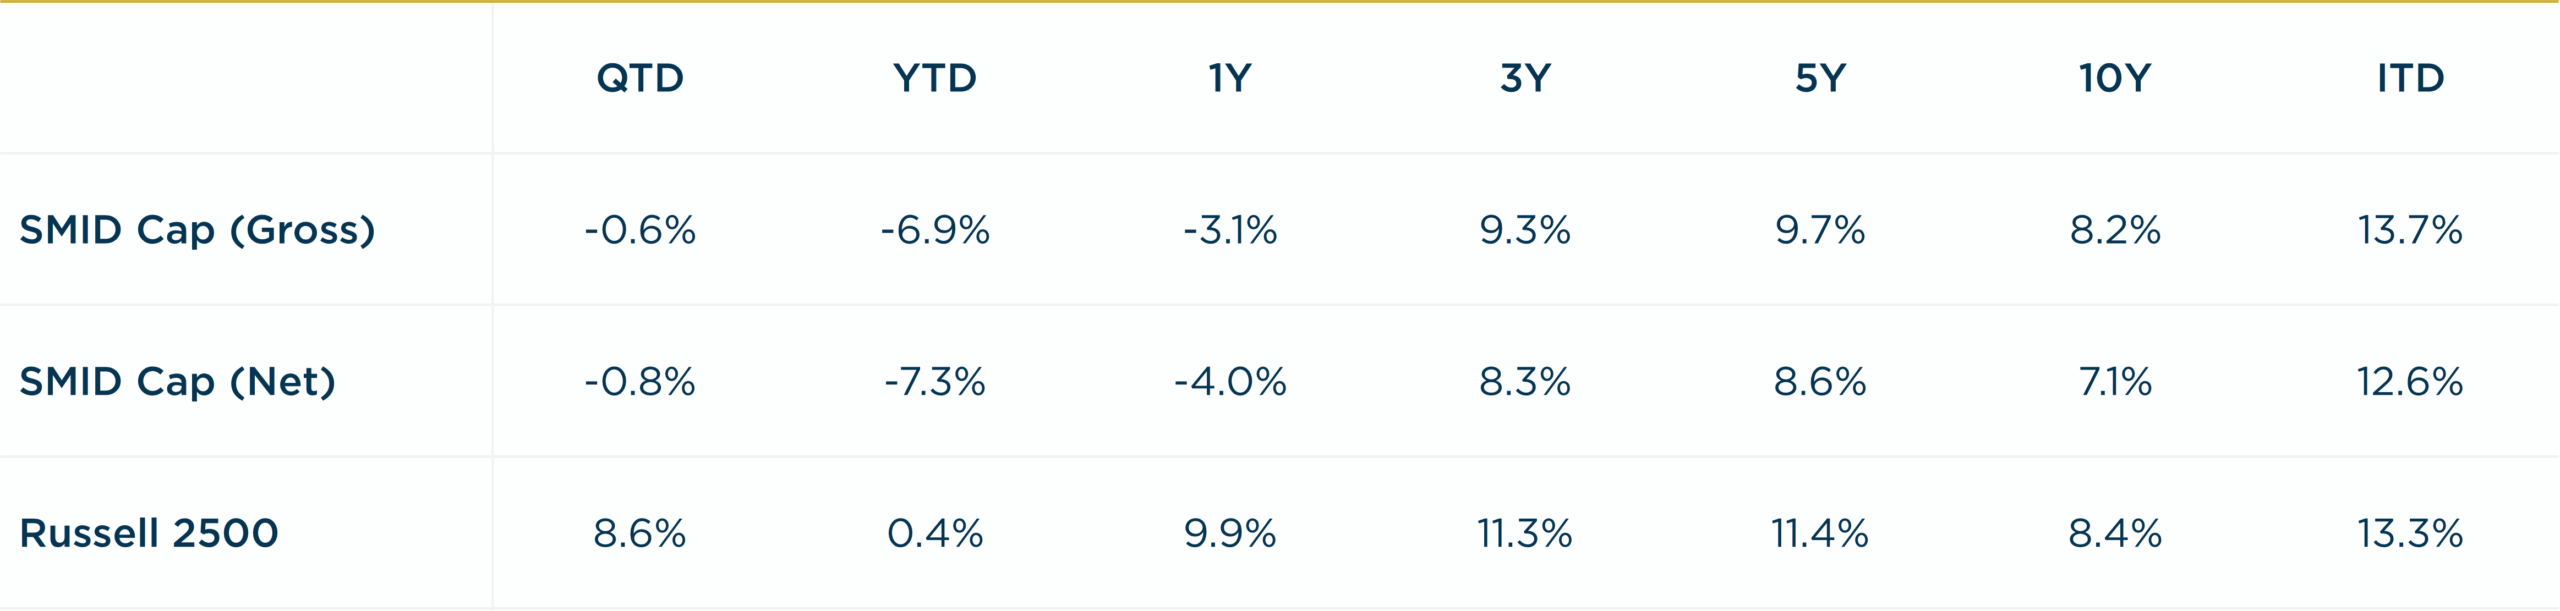
The London Company SMID portfolio decreased 0.6% (-0.8% net) during the second quarter vs. an 8.6% increase in the Russell 2500 Index. Sector allocation was a tailwind to relative performance, offset by stock allocation.
-
The SMID portfolio came up short of our 85-90% upside capture expectations in 2Q. Our exposure to Lower Volatility and Quality factors flipped from a tailwind in 1Q to a headwind in 2Q, as high beta and momentum driven rallied sharply following tariff de-escalation. Pockets of weakness across several holdings further exacerbated relative performance headwinds amidst the risk-on rally. We elected to maintain our position in a few of the weaker positions, reflecting our long-term conviction in the businesses. Fortunes can change quickly with a high conviction portfolio, and we remain confident in the operating metrics of portfolio companies. While the Index is broader down cap, the absence of owning the top performers contributed to nearly 20% of the underperformance this quarter. The recent strength of some of the riskier, more speculative Mid & Small Caps names is not driven by fundamentals nor is it sustainable longer-term.
Top 3 Contributors to Relative Performance
-
NewMarket Corporation (NEU) – NEU outperformed this quarter, fueled by strong AMPAC revenue growth from better volume and product mix, despite weaker Petroleum Additives results. The planned capacity expansion for the AMPAC business signals robust demand for rocket additives in a stable, oligopolistic market. Management prioritizes debt reduction and shareholder returns through dividends and buybacks.
-
Armstrong World Industries, Inc. (AWI) – AWI shares outperformed in the quarter due to beating expectations, driven by increased volumes from recent acquisitions and an increase in pricing. We continue to like AWI for its consistent execution, strong financials, leading market share and persistent moats through its exclusivity agreements and warranties.
-
AerCap Holdings (AER) – AER delivered strong performance this quarter, bolstered by solid Q1 2025 results and a favorable UK court ruling on $1B in insurance claims related to the Russia-Ukraine War. With the largest aircraft portfolio in a seller’s market, AerCap is well-positioned to grow book value per share through strategic asset sales and stock buybacks, capitalizing on robust market dynamics.
Top 3 Detractors from Relative Performance
-
Murphy USA, Inc. (MUSA) – MUSA was a bottom performer after reporting softer market share gains in Q1 due to lower retail fuel prices. With that said, the long-term components of our thesis remain intact: structurally higher industry fuel margins, everyday low price driving profitable market share gains, and value-creating capital allocation.
-
Saia, Inc. (SAIA) – SAIA remained weak this quarter as the lingering “freight recession” drags on for almost its third year. We remain convicted in our ownership of SAIA due to its solid balance sheet and strong network growth plan. We believe the company could be a multi-year compounder, assuming the freight industry returns to normal demand patterns.
-
White Mountains Insurance Group Ltd (WTM) – WTM was a bottom name after facing industry headwinds. For U.S. P&C insurers, performance was mundane in 2Q, whereas the rest of the market had a rebound. We remain confident in the company’s ability to deliver outsized growth in book value per share over time through prudent capital allocation.
Sector Influence
We are bottom-up stock pickers, but sector exposures influenced relative performance as follows:
-
What Helped: Underweight in both Energy and Real Estate (weaker performing sectors)
-
What Hurt: Overweight in Consumer Staples and Materials (weaker performing sectors)
Trades During the Quarter
-
Exited: Cannae Holdings, Inc. (CNNE) – Underperformed in recent years and was only 1% of the portfolio. Our initial thesis centered on Bill Foley’s ability to create value and the most valuable asset of CNNE was Dun & Bradstreet. That investment has not worked out and CNNE shares have lagged the broader market. We elected to sell the remaining position.
-
Reduced: AerCap Holdings (AER) – We trimmed AER on strength. The stock has significantly outperformed the broader market since early 2021. We remain confident in the outlook for air travel and for AER to benefit by leasing planes to the largest airlines.
-
Increased: Saia, Inc. (SAIA) – With recent weakness and a smaller beginning weight in the portfolio, we felt it was prudent to add to the shares and make it a 3% position.
-
Increased: Zebra Technologies Corporation (ZBRA) – Added to the position following weakness in the shares early in the year. Concerns around tariffs and weaker tech spending provided a more attractive valuation.
-
Initiated: Somnigroup International Inc (SGI) – Formerly Tempur Sealy, SGI is the combined company of Tempur Sealy the acquired Mattress Firm. SGI is the clear leader in the bedding industry, and the company is gaining market share while generating robust free cash flow. Strong brand equity, solid management execution, and vertical integration from the acquisition support our investment thesis. Currently, the bedding market is weak with volumes near a 30-year low. Higher mortgage rates and rising home prices may limit unit sales in the short term. Longer term, we believe that an eventual industry rebound, synergies from the acquisition, and greater innovation are keys to the company’s success. We have owned SGI in the past and just sold it from the Small Cap portfolio due to its rising market cap following the acquisition of Mattress Firm.
Looking Ahead
There is elevated uncertainty as we start the second half of 2025 with a high likelihood of greater tariffs being announced in the weeks ahead. Consumer confidence has declined recently due to the risks of additional tariffs, but the broader economic data still supports growth in the near term, although growth is decelerating. While we are not predicting a recession, the odds of a recession have increased. In terms of monetary policy, the Fed appears to be on a steady course for two or three rate cuts later in the year. The effect of tariffs on both inflation and the broader economy could change those plans, though.
In terms of the equity market, the S&P 500 is back to the expensive, concentrated territory in which it began the year. Meanwhile, the macro risk backdrop has deteriorated since the start of 2025, including labor market softening, ongoing tariff uncertainty, debt headwinds, geopolitical tensions, and unclear inflation trends. Equity returns in the near term may be modest, with shareholder yield (dividends, share repurchases, debt reduction) comprising a significant percentage of the total return from equities. We believe our high-Quality, low-Volatility orientation positions us well for an environment of elevated policy risks and fragile global growth. We remain rooted to our long-term, fundamental investment approach, focusing on company quality, sustainable returns on capital, and resilience across economic scenarios.
Annualized Returns
As of 6/30/2025
Inception date: 3/31/2009. Performance is preliminary. Subject to change. Past performance should not be taken as a guarantee of future results. Net of fee returns are calculated net of a model management fee of 1.00%. Please see the disclosure notes found on the bottom of the page.