Case for Quality: In this report, we define Quality, show how Quality metrics have performed over time, and demonstrate why a focus on Quality factors can lead to higher returns.
The Current Environment
As we enter the final months of 2021, the US economy continues to recover following a global pandemic. The pandemic led to a brief recession, but caused longer-lasting issues including disruptions in supply chains across various industries as well challenges in the labor market. Monetary policy has been very accommodative and the federal government has offered generous benefits to the unemployed, which has aided consumer spending. As the economic recovery gathers steam, we expect the Fed to begin to remove some accommodation soon, most likely by tapering Quantitative Easing, and then with possible increases in the fed funds rate down the road. At the fiscal level, we may see tax increases on the wealthy as well as higher corporate taxes.
While we aren’t predicting a recession, we believe economic growth will continue to decelerate, core inflation will likely stay above the low levels of prior years, and equity returns may be more modest, along with greater volatility in share prices. In that environment, we believe investors will be rewarded by following a long-term approach, with a focus on Quality factors that help dampen volatility.
Maintain a Long-Term Perspective
As we are well aware, equities generate stronger absolute returns over time relative to other asset classes, but with greater volatility. The chart below shows compound annual returns over almost 100 years, as well as the standard deviation of those returns for various asset classes. The crucial point revolves around the incorporation of the requisite equity exposure needed to meet return expectations while mitigating the volatility inherent in that exposure.
We believe taking a long-term approach and focusing on quality metrics can achieve that aim, foremost by mitigating downside risk. Additionally, such an approach helps investors avoid being victimized by any tendencies to buy and sell on short-term news and emotion.
In this report, we will define what we mean by Quality, show how Quality metrics have performed over time, and help you understand why a focus on Quality can lead to higher returns and less volatility.
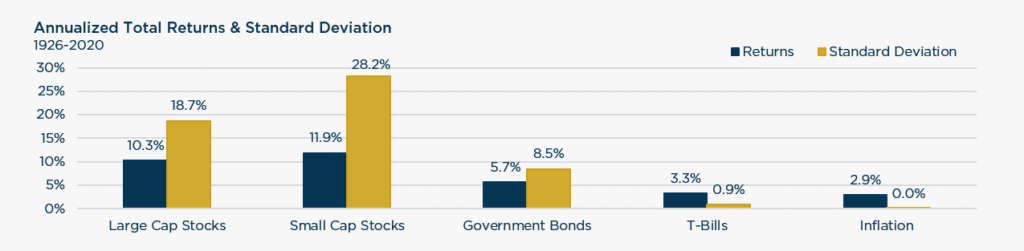
Source: Strategas. The indexes are proprietary to Stocks, Bonds, Bills, and Inflation® (SBBI®) Yearbook by Roger G. Ibbotson and Rex Sinquefield—updated annually. Past performance should not be taken as a guarantee of future results.
How to Define Quality?
At The London Company, quality refers to companies with durable competitive advantages leading to consistently high returns on capital, consistent cash flow generation, and balance sheet strength. We believe those characteristics are the key drivers of downside protection over time.
For this review, however, we expanded our definition a bit and included a few other factors using Style Analytics, a data provider that allows a manager to review the market or its portfolios across various categories of factors including Growth, Value, Quality, Size, etc. Style Analytics data can help ensure portfolio characteristics are consistent with expectations and help avoid any unintended bets. At the broader market level, the data provide details about specific factors driving the market over various time periods.
While there are many quality factors to choose from, we believe the most important factors for investors are: return on invested capital, return on equity, net profit margin, sales growth stability, earnings growth stability, and low debt. It is these factors that lead to downside protection and the goal of outperformance with less risk. Let’s define each factor before getting into the details:
-
Return on invested capital (ROIC) – We calculate return on capital by taking operating profit divided by average capital (debt and equity). It shows how much cash flow the company is generating divided by the cost of financing the business. We believe return on capital is not only a good measure of profitability, but also shows how efficient management is with the company’s assets. Ultimately, we are looking for companies that can generate consistent operating cash flow regardless of the economic environment with limited capital spending needs.
-
Return on equity – We calculate return on equity as the net income divided by book equity. We use this for certain industries where return on capital isn’t relevant. An example would be banks where debt is used by the firm to generate net interest margin.
-
Net profit margin – We calculate net profit margin as the net income divided by sales. We want to make sure the company generates reasonably high margins. Low margin businesses have less margin for error and can be wiped out if rates rise or if we enter a recession.
-
Sales growth stability – Measuring the standard deviation of sales over time. Our preference is less volatility.
-
Earnings growth stability – Measuring the standard deviation of earnings over time. Again, our preference is less volatility.
-
Low debt – Looking for companies less burdened by debt repayment costs. This can be a negative if rates rise or the economy weakens. Self-funding in difficult times is very important.
Beginning with an initial universe of all US listed stocks with market capitalizations above $50M (3000-5000 each month over the full period), we back-tested each of the six Quality factors over the last 30+ years and calculated a weighted score for each company based on all six factors. From these calculations, we created a Quality Composite made up of the top quartile of the weighted average of the total scores for each company. For each factor, we reviewed performance for the top 25% of each group over each period. Each factor and composite is sector adjusted, meaning the sector weights for each are in line with the broader market. Our data covers the period between September 1989 through September 2021, for a total of roughly 31 years or 373 months.
Before looking at returns, it is important to note that Quality factors tend to post their best relative performance during flat/down markets. That can require patience from investors since stocks tend to rise over time. In the 30+ years we tested, the market rose in 65% of the months (243) tested and declined the other 35% of the months (130) tested.
Market returns tend to be positive over time, but investors should never underestimate the power of downside protection. Losing less in down markets can be one of the best ways to generate outperformance over many years. Even though a portfolio with a higher Quality tilt may underperform the broader market over half of the time, reasonable upside capture (80-85%) combined with superior downside capture (75%) will result in very strong relative performance over a full market cycle.
Quality factors tend to post their best relative performance during flat/down markets, requiring patience from investors, since stocks tend to rise over time.
For the purposes of this illustration, the Broader Market1 is defined as all listed US equities >$50M in market capitalization. In our study, each Quality factor, with the exception of earnings growth stability, outperformed the broader market over the same time period. Return on capital performed the best and the Quality Composite was next. Again, the composite is a mix of all the quality factors. The composite outperformed the broader market by 190bps annually, which is quite impressive.
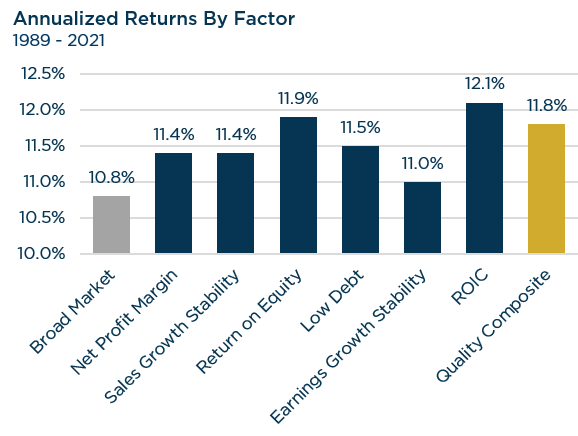
Source: Investment Metrics, as of 9/30/21. The ‘Broad Market’ is defined as all listed US equities >$50M in market capitalization with the starting universe as all US listed stocks from the Thomson Reuters Worldscope database. The ‘Quality Composite’ methodology takes a z-score tilt of each factors and then weights them equally to get a weighted average quality z score. The top 25% weighted averaged z-score stocks are put into the quality portfolio (by market cap). Past performance should not be taken as a guarantee of future results.
To get another opinion, we reached out to a different data provider to see if they had tested Quality factors over time.
In this case, Strategas came back with similar results. They reviewed various factors across five quintiles of the Russell 3000. The table below shows the annualized relative returns for the top quintile of companies vs. the bottom quintile.
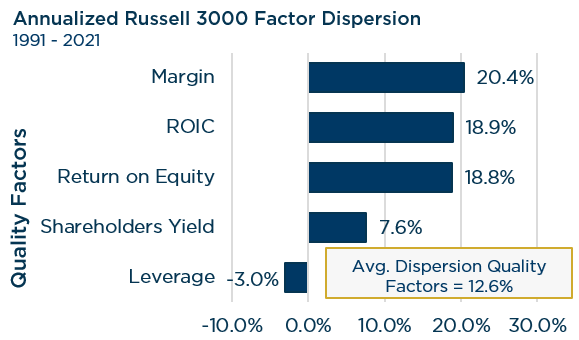
Source: Strategas, as of 9/30/2021. Past performance should not be taken as a guarantee of future results.
So it is a bit different in that it isn’t judging the returns vs. the broader market, but you can see the benefit to focusing on the higher quality universe. Companies with high margins and higher returns (ROIC and ROE) significantly outperformed companies with lower margins and returns. Leverage was negative, meaning highly leveraged companies underperformed companies with less leverage. We should keep this in mind as corporate debt has increased in recent years due to the low interest rate environment.
Relative Performance in Up vs. Down Markets: Long Term Results
So we can make the case to focus on Quality by simply showing these factors have driven outperformance in the past. However, it is important to remember that stocks tend to move higher over time and Quality factors can be a headwind to performance in rising markets. The table below makes that case.
What we see is each Quality factor outperformed during market downdrafts. Stability was the best performing factor when the market was down and the combination of stability, higher returns and margins, and balance sheet strength drove the composite to have the best downside performance. Low debt outperformed in down periods, but not significantly. On the flip side, most of the Quality metrics posted weak relative performance in rising markets. The exceptions are return on capital and low debt. In the case of debt, what we learned is low debt isn’t a significant driver of outperformance over time. However, high debt levels can be disastrous to performance when the economy is weak. So balance sheet strength is important, but it is much more important to avoid companies with very high leverage.
High return on capital outperformed in down markets, but slightly outperformed in rising markets too. If you are correct about the sustainability of return on capital, you have possibly found a business with a strong competitive advantage. The strength of that competitive advantage could potentially drive higher growth over time. That leads to return on capital doing well in good times and bad. Remember it was the best performing factor we tested over the last 30 years. At The London Company, our heavy focus on stability of return on capital leads to our portfolios having stronger growth characteristics than a pure value oriented portfolio.
In our study, each Quality factor outperformed the broader market over the 30+ year time period; additionally, each Quality factor outperformed in down markets.
Relative Performance in Up vs. Down Markets: Shorter Term Results
Over shorter time periods, Quality tends to do best in flat, down, or slightly positive markets. Over the last 20 years, the Quality factors posted their strongest relative performance in years like 2000-2002 (post the tech bubble), 2008 (Great Recession), 2011 (flat year with concerns in the US about a double dip recession and sovereign debt issues in Europe), and 4Q18 (concern that the Fed was raising rates too fast). We believe Quality factors should outperform again in times of greater volatility, economic slowdown, or elevated uncertainty the future environments as those. Looking at the first quarter of 2020, during the early stages of the COVID-19 pandemic, Quality factors outperformed. In fact, each of the six quality metrics outperformed the broader market during the first quarter of 2020. Again, in times of greater volatility, economic slowdown, or elevated uncertainty, Quality factors will often outperform.
Quality factors tend to lag in rising markets, especially when stocks are compounding at double digit rates. Examples here are the tech bubble in the late 90s, 2003 (recovering economy after three consecutive annual declines in the S&P 500), 2009 (bounce back after March 2009 low), and as the market rallied beginning in April of 2020.
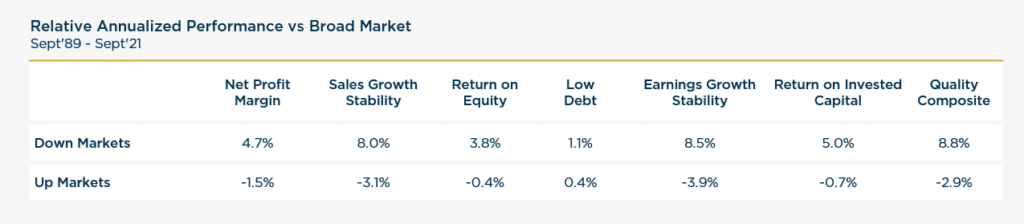
Source: Investment Metrics, as of 9/30/2021. Up Markets and Down Markets reflect monthly performance instances of positive and negative returns. The ‘Broad Market’ is defined as all listed US equities >$50M in market capitalization with the starting universe as all US listed stocks from the Thomson Reuters Worldscope database. The ‘Quality Composite’ is equally weighted the six factors on our default Skyline (the ones included individually). The methodology takes a z-score tilt of each factors and then weights them equally to get a weighted average quality z score. The top 25% weighted averaged z-score stocks are put into the quality portfolio (by market cap). Past performance should not be taken as a guarantee of future results.
How Do We Gauge if Companies Can Maintain These High-Quality Attributes?
The simple answer is to focus on sustainability of return on capital and balance sheet strength. We start our investment process by narrowing our universe to companies we believe can generate sustainably high returns on capital. There isn’t a magic level of ROC, but we look for companies with returns comfortably above the cost of capital. As a reminder, the cost of capital is simply how much it costs the owners to run the business using debt or equity.
High returns on capital are typically driven by competitive advantages like brand strength, distribution, cost advantages, scale, barriers to entry, and government regulations. These competitive advantages drive higher margins and pricing power. We also look at the industry structure of any potential investment and prefer more consolidated industries where there tends to be better pricing discipline. Also, family run businesses frequently have a solid track record of good capital allocation decisions, which is why we own quite a few family-owned businesses.
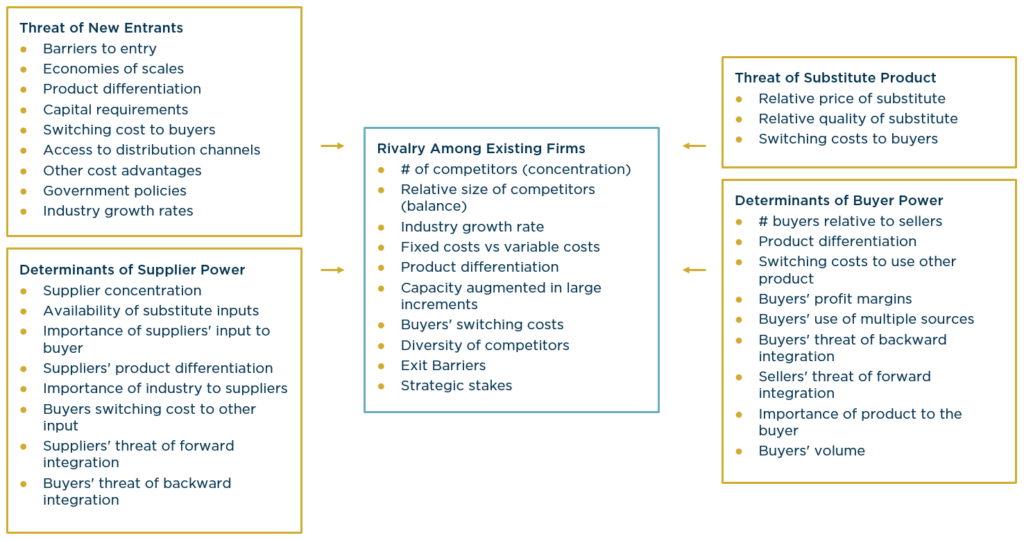
Before purchasing any company, considerable time is spent evaluating the strength and durability of its competitive advantage. The easiest way to summarize our research on each company’s competitive advantage is to point to Michael Porter’s five forces model (shown below).
We won’t go into much detail here, but we believe that if a company benefits from high barriers to entry, limited competition, high switching costs, etc., it can charge higher prices for its products or services with limiting capital spending needs. Stable sales, rising/stable margins, and consistent cash flow are byproducts of a sustainable competitive advantage and good for shareholders over time. We seek these attributes in any holding.
Finally, we have shown that over multiple decades, the high return on capital universe typically outperforms the broader market, over a full market cycle. By investing in companies with such attributes, we believe it helps raise our odds of outperformance and can limit the downside risk in any holding. One of the biggest risks is disruptive innovation within an industry that may lead to lower returns on capital over time. Therefore, we have to be diligent and stay on top of what is going on at the company and industry level to avoid fundamental deterioration at any company.
Past performance should not be taken as a guarantee of future results.
Conclusion
It is not easy to predict the future of the economy or the stock market in general. That said, we maintain a positive view of the US economy, but expect decelerating GDP growth as we enter 2022. COVID-19 variants remains a potential risk, but we don’t expect large scale shutdowns like we experienced in 2020.
We believe consumer spending will continue to be the primary driver of GDP as the labor market improves along with moderate wage inflation. In addition, excess savings built up during the pandemic should aid consumer spending in the near term. Separately, the manufacturing and services segments of the economy are firmly in expansionary territory. Fiscal stimulus may start to wane in the months ahead, and the Fed will likely begin to reverse some of its more accommodative monetary policies later this year and into 2022. This could lead to slower growth in 2022. Longer term, we remain optimistic about the prospects for the US economy.
In terms of the equity market, we recognize valuations are on the rich side, while interest rates will likely remain low vs. history. At current valuations along with various short term risks to the economic outlook (rising inflation, changes in monetary policy, potential tax increases), we expect greater volatility in share prices and possibly more muted returns in the future. In this environment, we believe investors will be rewarded by taking a long term approach, with a focus on quality factors that help dampen volatility.