Market Observations & Portfolio Commentary
SMID Cap – 2025 vs. R2500
Full Year Market Update
U.S. equities posted strong gains in 2025, marking a third consecutive year of double-digit returns, with the Russell 3000 Index rising 17.2%. The year was shaped by robust earnings growth, continued AI enthusiasm driving technology leadership, and incrementally more supportive monetary policy. However, the market navigated significant volatility, particularly during the spring tariff uncertainty when the S&P 500 fell nearly 19% before recovering. The Federal Reserve reduced rates by 75 basis points in the second half of the year, responding to moderating growth and signs of labor market softening while inflation remained above target. Trade policy uncertainty and tariff developments contributed to periodic volatility, though markets generally proved resilient as implementation timelines shifted.
Like recent years, equity market leadership was again concentrated in Large Cap Growth companies, particularly within technology-oriented areas tied to artificial intelligence, as the equal-weight S&P 500 meaningfully trailed its cap-weighted counterpart. Stylistically, Growth led Value for the year, and Large Caps outperformed Small Caps. Sector performance was mixed, with cyclical leadership led by Communication Services, Technology, and Industrials, while more defensive areas lagged. Among market factors, Growth, Volatility, and Size factors posted the strongest relative returns. Momentum also helped. The Quality and Yield factors were large headwinds. The Value factor was mixed.
Key Performance Takeaways for the Year
-
The London Company Small-Mid Cap portfolio declined 3.8% (-4.8% net) year-to-date vs. a 11.9% increase in the Russell 2500 Index. Both sector exposure and stock selection were headwinds to relative performance.
-
Our SMID portfolio underperformed for the year and came up short of our upside participation expectations. The full year report card may be disappointing, but it masks the notable developments and context beneath the surface. All the relative weakness occurred between April and October. A historically strong rally in unprofitable, high-beta stocks drove market gains down cap, which our Quality-focused, Lower-Volatility portfolio did not fully capture. Additionally, the portfolio faced sector headwinds, and pockets of idiosyncratic weakness weighed on performance. That said, the portfolio outperformed in Q1 and exceeded our upside capture expectations in Q4. It played strong defense amid the volatility early in the year, and it gained ground in the final months as high beta lost traction.
-
In our view, this is a market where discipline matters more than bold forecasts, and portfolios should be prepared for a wider range of possible outcomes. We believe our Quality-at-a-Reasonable-Price approach may offer participation in market upside while providing the differentiation that may matter most if volatility increases or leadership shifts.
Top 3 Contributors to Relative Performance
-
AerCap Holdings (AER) – AER shares performed well all year after reporting solid quarterly results. We believe the company is sitting in the enviable position of owning the largest portfolio of aircraft in a seller’s market. The insurance recoveries during the year were a nice windfall, which was used to repurchase shares. The company should be able to continue growing book value per share via large purchase leasebacks or M&A, given its historically low leverage.
-
Armstrong World Industries, Inc. (AWI) – AWI shares outperformed for the year as they continue to operate well, employing key initiatives to offset a choppy market outlook and low volumes. We continue to like AWI for its consistent execution, strong financials, leading market share and persistent moats through its exclusivity agreements and warranties.
-
NewMarket Corporation (NEU) – NEU has been a top performer this year, driven by strong results in its newly acquired defense businesses and stronger profitability in its core business. Despite the lumpiness in the business, its rocket business shows strength led by further global conflicts and stockpile replenishment. Finally, the company has been using cash flow to repay outstanding debt, which the market is viewing positively.
Top 3 Detractors from Relative Performance
-
Deckers Outdoor Corporation (DECK) – DECK has been a top portfolio performer over the past three years, driven by strong execution, though its high valuation prompted us to trim our position three times in 2024. Despite a weakness this year in HOKA’s growth rate, the fundamentals of DECK’s footwear brands remain robust. Management’s long-term brand strategy and a debt-free balance sheet provide resilience and downside protection.
-
Zebra Technologies Corporation (ZBRA) – ZBRA was an underperformer this year as the escalation of global trade tensions disrupted its highly globalized supply chain and caused customers to delay projects, despite entering 2025 with a favorable setup. With most tariff impacts now mitigated, we continue to see significant upside given ZBRA’s high incremental margins and competitive positioning, which should drive a sharp rebound as macro conditions normalize.
-
Murphy USA, Inc. (MUSA) – MUSA has been a weaker name this year after reporting slower volume growth and market share gains. A stretched consumer also impacted results. It is harder to take share in a low fuel price environment, but MUSA’s everyday low price offering on fuel and convenience items defines its competitive advantage. The long-term components of our thesis remain intact: structurally higher industry fuel margins, everyday low price driving profitable market share gains through the cycle, and value-creating capital allocation.
Sector Influence
We are bottom-up stock pickers, but sector exposures influenced relative performance as follows:
-
What Helped: Underweight Real Estate (a weaker performing sector) & overweight Industrials (a better performing sector)
-
What Hurt: Overweight Consumer Staples (a weaker performing sector) & underweight Health Care (a better performing sector)
Portfolio Characteristics & Positioning
We believe the SMID portfolio is positioned for long-term durability and possesses the fundamental ingredients that stand the test of time: wide moats, sustainably high returns on capital, strong cash flow generation, low leverage ratios, and trading at a reasonable valuation. As a corporate debt maturity wall approaches and the cost of that capital stays elevated, we believe companies with strong balance sheets and the ability to self-fund their operations could have a structural advantage in 2026 and beyond. In an environment of possibly lower returns and greater volatility, we believe the SMID portfolio offers an attractive option for equity investors.
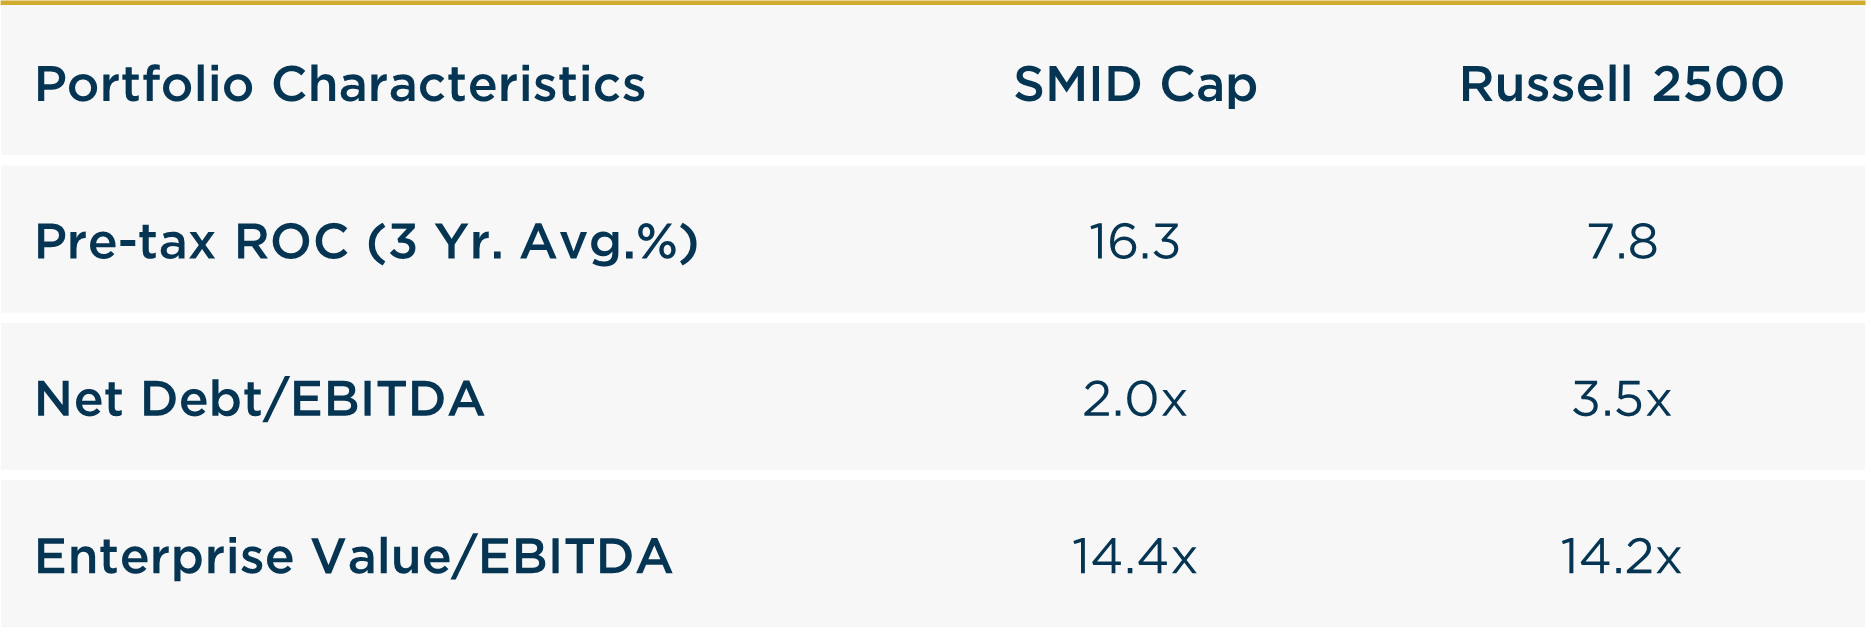
Source: FactSet
Looking Ahead
As we move into 2026, the economic and policy backdrop remains characterized by a mix of support and uncertainty. On the positive side, corporate earnings trends have remained better than expected, consumer activity has shown resilience, and ongoing Fed rate cuts combined with fiscal stimulus measures may continue to support growth. At the same time, late-cycle dynamics are becoming more evident. Labor market softening, affordability pressures, and persistent housing weakness underscore the uneven nature of growth. Trade and tariff policy remain fluid, and elevated complacency leaves markets vulnerable to adverse surprises. Against this backdrop, economic and inflation data may remain volatile, increasing the likelihood of episodic market dislocations. Despite resilient earnings trends and elevated hyperscaler capital spending, we believe caution is prudent given these crosscurrents.
From an equity market perspective, strong headline returns have masked growing dispersion beneath the surface. Leadership has remained narrow and valuation risk increasingly concentrated, raising the possibility that company-specific risks could take on broader significance. Periodic risk-on rallies, particularly among high-beta and lower-quality segments, have contributed meaningfully to recent performance, but history suggests such episodes are rarely durable. We believe the environment is becoming more conducive to broader leadership and a return to fundamentals, where earnings growth, dividends, and balance-sheet strength matter more than valuation multiple expansion. As volatility rises, downside protection is likely to be driven by companies with high and stable returns on invested capital, conservative leverage, and reasonable valuations. Our portfolios remain anchored in these attributes, which we believe offer a more resilient path through shifting market regimes and help clients participate in long-term wealth creation while managing downside risk.
Annualized Returns
As of 12/31/2025

Inception date: 3/31/2009. Performance is preliminary. Subject to change. Past performance should not be taken as a guarantee of future results. Net of fee returns are calculated net of an annual model management fee of 1.00%. Please see the disclosure notes found on the bottom of the page.