
Market Observations & Portfolio Commentary
International Equity – 3Q2026 vs MSCI EAFE
Market Update
Global equity markets posted modest gains in the third quarter, but the strong momentum of the second quarter faded. Progress toward a lasting resolution in the Middle East stalled, pushing oil prices higher, while the AI and semiconductor trade paused after a powerful run. The MSCI ACWI Index gained 1.6%, while the S&P 500 rose 2.3%. The MSCI EAFE Index returned 0.8%, again trailing the U.S., as Japan rose 6.0% and Europe declined 1.6%. Emerging Markets slipped 0.4% after last quarter’s surge.
Renewed energy-driven inflation broadened the hawkish shift among central banks. The Federal Reserve raised rates in September for the first time since 2023, the ECB delivered its second hike of the year, and the Bank of Japan lifted its policy rate to the highest level since 1995.
Within the MSCI EAFE, sector leadership rotated sharply once again. Energy rose 20%, while Financials gained 6% on higher rates. Information Technology fell 8% after surging 55% last quarter, and rate-sensitive and defensive sectors lagged. Among factors, Value and Yield were positive contributors, Size, Volatility, and Momentum were headwinds, and Growth and Quality had mixed results.
Key Performance Takeaways
-
The London Company International Equity portfolio declined 1.7% gross (-1.9% net) vs. a gain of 0.8% for the MSCI EAFE Index. Both sector exposure and stock selection were headwinds.
-
The International Equity portfolio trailed the benchmark and came up short of our 85-90% upside capture expectations. Index returns were unusually narrow, as Banks and Energy, where the strategy holds no positions, accounted for more than the MSCI EAFE’s entire gain. Returns in both tend to be driven more by rates and commodity prices than by the durable competitive advantages we seek. Stock-specific weakness in a few holdings also weighed on results, but we view these as temporary dislocations.
-
The portfolio’s valuation premium to the benchmark has narrowed meaningfully over the past year, even as our holdings generate far higher returns on capital with considerably less leverage. We believe this combination positions the portfolio well over a full market cycle.
Top 3 Contributors to Relative Performance
-
SAP SE (SAP GY) – SAP GY rallied during the quarter, recovering sharply from earlier weakness tied to AI disruption concerns. Second-quarter results showed the current cloud backlog accelerating to 26% growth, which supports our on-prem to cloud conversion thesis. We remain attracted to SAP GY’s high switching costs, sticky recurring revenue, attractive valuation, and solid balance sheet.
-
Nintendo Ltd. (7974 JP) – 7974 JP shares rose during the quarter as demand held up better than feared despite higher console prices and memory costs. Digital sales grew 90%, and management maintained its full-year forecast of 16.5 million Switch 2 consoles. We believe long-term value will be driven by software, digital monetization, and its intellectual property ecosystem, while its large cash balance provides downside protection.
-
Willis Towers Watson, PLC (WTW) – WTW gained during the quarter on strong organic growth and operating leverage. Second-quarter organic revenue grew 5%, adjusted operating margin expanded 100 basis points, and adjusted EPS rose 17%. The company also introduced enterprise margin targets of approximately 30% by 2028, which we believe are achievable, and sentiment around AI disintermediation risk improved.
Top 3 Detractors from Relative Performance
-
Universal Music Group (UMG NA) – UMG NA declined during the quarter after second-quarter results missed expectations due to elevated costs and muted subscription growth, while fears of AI disruption remained an overhang. We believe the margin compression reflects temporary headwinds and expect UMG NA to benefit from DSP price increases and improved cost discipline. We see AI as more of an opportunity than a risk for UMG NA’s unrivaled catalog. Valuation is attractive and supports downside protection.
-
CRH PLC (CRH) – CRH declined during the quarter even though the company reported a record second quarter, with earnings ahead of expectations, and reaffirmed its 2026 guidance. Concerns around cost inflation, subdued residential demand, and uncertain infrastructure spending weighed on the construction materials sector, concerns we view as temporary. CRH’s vertical integration, leading positions in diverse end markets, strong balance sheet, and prudent capital allocation support our conviction.
-
DSV A/S (DSV DC) – DSV DC declined during the quarter on fears of earnings downgrades tied to the integration of DB Schenker. In our view, the market’s reaction to transitory integration challenges is overly punitive, and the combined entity underpins an attractive margin expansion opportunity. Valuation is compelling and supports downside protection.
Sector Influence
We are bottom-up stock pickers, but sector exposures influenced relative performance as follows:
-
What Helped: Underweight Utilities (one of the weakest performing sectors). Overweight Communication Services (a better performing sector).
-
What Hurt: Underweight Energy & Financials (better performing sectors).
Trades During the Quarter
-
Initiated: DSV A/S (DSV DC) – DSV is the world’s largest freight forwarder with leading positions in Air & Sea and European road freight and a top five position in contract logistics. DSV’s asset-light model generates attractive returns on capital and its ability to aggregate customer demand and leverage purchasing power across a fragmented, asset-heavy transportation industry underpins its durable competitive position. Combined with a proven track record of value-accretive M&A, these attributes have driven consistent margin improvement and market share gains. We believe the market is underappreciating the earnings potential from the DB Schenker integration, as temporary integration costs distract from the opportunity for further margin expansion. We see attractive upside as margins recover and the company’s earnings power is better reflected in the share price, supported by an experienced management team and disciplined, shareholder-aligned capital allocation.
-
Reduced: Taiwan Semiconductor Manufacturing Co., Ltd. Sponsored ADR (TSM), ASML Holding NV (ASML NA), and Safran SA (SAF FP) – We trimmed these positions to reallocate capital to opportunities with better risk/reward.
Looking Ahead
As we approach year-end, the policy response we described last quarter has evolved into a broad, synchronized tightening cycle. With progress in the Middle East stalled and energy prices elevated, the Federal Reserve, the ECB, and the Bank of Japan are now raising rates together, while inflation remains above target in the U.S., Europe, and the UK. Growth has held up, but tighter financial conditions and higher energy costs are likely to weigh on activity over time. We would not be surprised to see continued volatility as markets adjust to what appears to be a later stage of the business cycle. As always, our strategy remains unchanged. We continue to look past short-term noise, focusing on long-term fundamentals and assuming modest economic growth as we select companies from the bottom up.
Market leadership has swung sharply again this year, from energy and defensive names at the outbreak of the conflict, to AI and semiconductors on de-escalation, and back to energy and banks this quarter. These rotations have been driven largely by interest rates and commodity prices rather than company fundamentals. We do not view this leadership as sustainable, and we do not need it to collapse, only to normalize. Historically, equities have often struggled early in tightening cycles before recovering where earnings held up, favoring companies with pricing power, durable cash flows, and strong balance sheets. Share price weakness in several high-quality businesses with intact fundamentals has created attractive opportunities at significant discounts to the U.S. While timing a leadership shift is impossible, we remain confident that our portfolios are well positioned to participate as fundamentals reassert themselves while helping to manage downside risk.
Annualized Returns
As of 9/30/2026
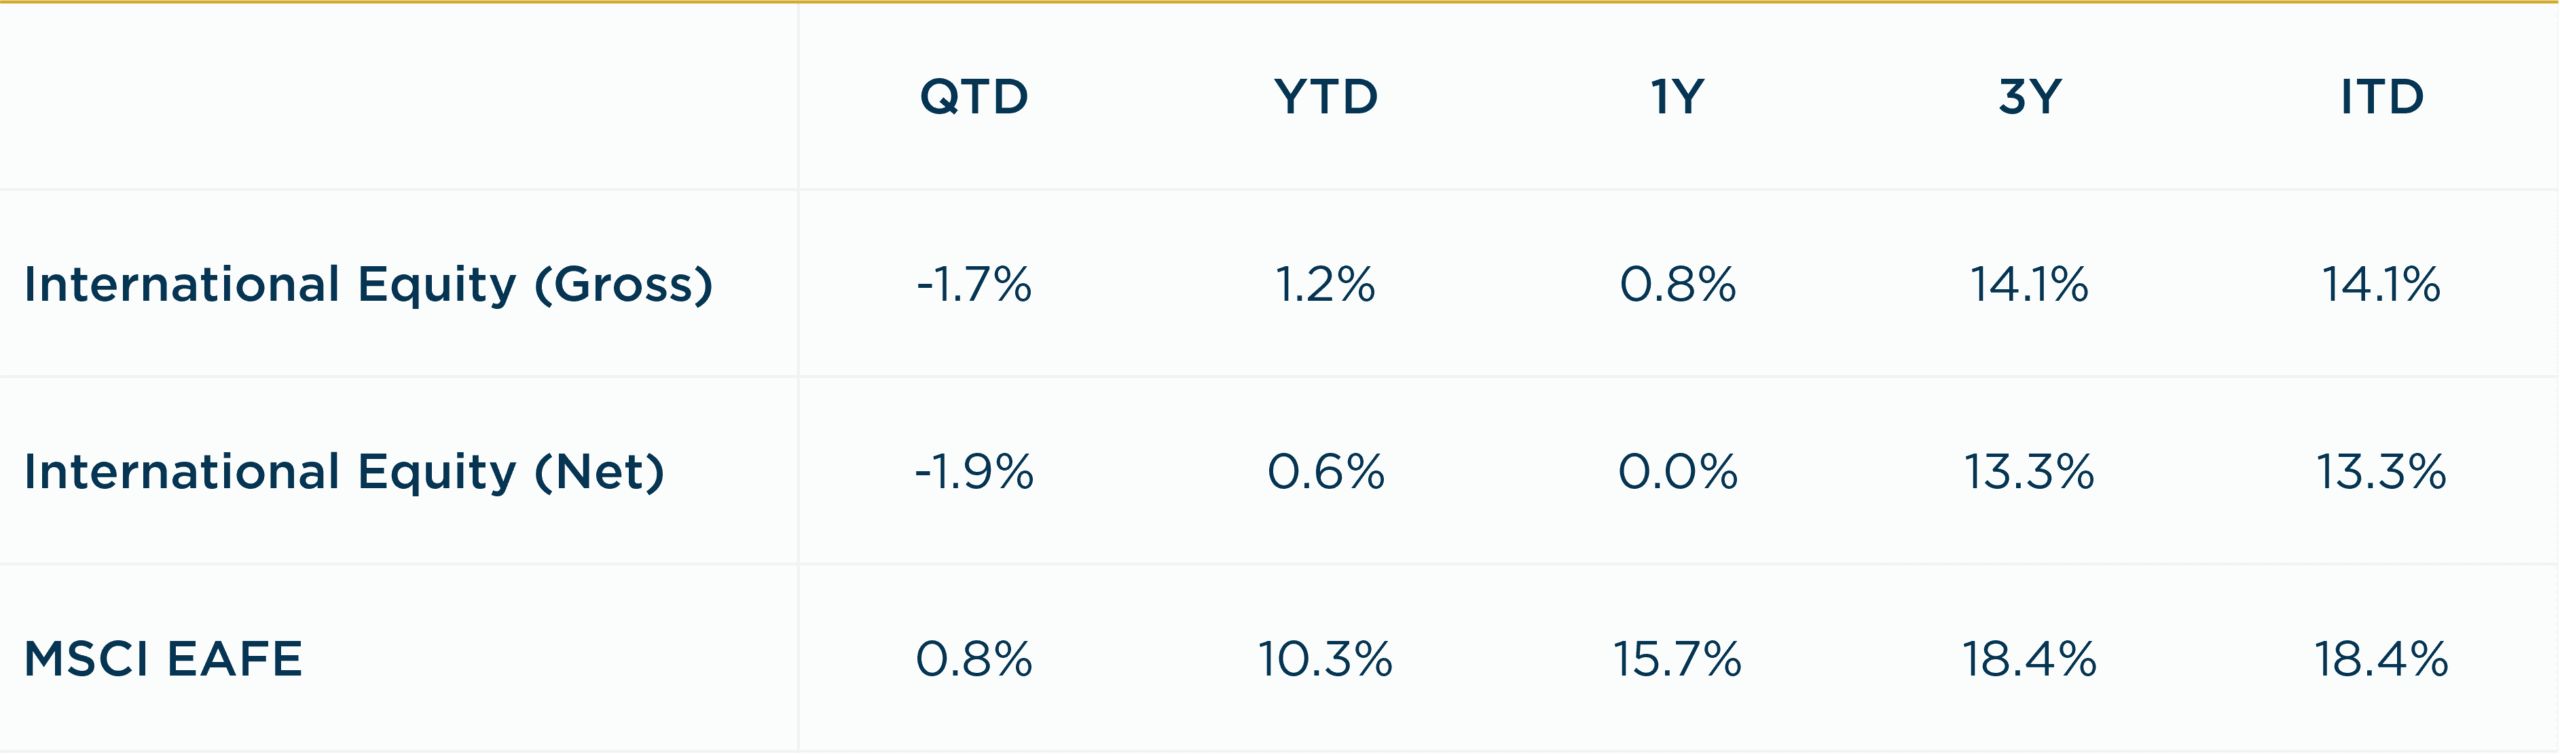
Inception date: 9/30/2023. Performance is preliminary. Subject to change. Past performance should not be taken as a guarantee of future results. Net of fee returns are calculated net of an annual model management fee of 0.75%. Please see the disclosure notes found on the bottom of the page.