
Market Observations & Portfolio Commentary
Small Cap – 3Q2026 vs. Russell 2000
Market Update
U.S. equities were mixed in the third quarter, with modest index gains but weak participation beneath the surface. The Russell 3000 returned 1.4%, but the average S&P 500 stock declined and Small Caps fell sharply. Strong earnings and improving PMIs supported Large Caps, while the breakdown of U.S.-Iran peace efforts sent oil sharply higher and reignited inflation concerns. The Fed raised rates 25 basis points in September, its first hike since 2023. Treasury yields rose across the curve, with the 10-year at its highest level since 2002. Higher oil and rates compressed valuations and weighed on consumer confidence.
Equity leadership shifted sharply during the quarter. The high-beta and the momentum rally that peaked in late June reversed, and Large Caps were the only size segment to post gains as the Russell 2000 fell 7.2%. Breadth was weak, with the Equal-Weight S&P 500 trailing its cap-weighted counterpart by more than four percentage points. Energy led all sectors as oil surged, and Technology advanced as a software rebound offset weakness in semiconductors. Utilities and Industrials lagged. From a factor perspective, Value, Quality, Size and Yield were all positive. Momentum and Volatility were negative, while Growth factors were mixed.
Key Performance Takeaways
-
The London Company Small Cap portfolio declined 2.2% (-2.5% net) during the quarter vs. a 7.2% decrease in the Russell 2000 Index. Outperformance was driven by stock selection, partially offset by sector exposure.
-
The Small Cap portfolio outperformed the Russell 2000 in a down quarter, holding up comfortably better than our 75–80% downside capture expectations. Rising rates and a return to quality cooled the speculative rally in smaller stocks over the summer, and the portfolio’s lower-volatility profile held its ground amid the selloff in September. With credit spreads on the lowest-rated corporate debt widening sharply, we believe our focus on durable businesses with strong balance sheets positions the portfolio well should higher rates strain more leveraged companies.
Top 3 Contributors to Relative Performance
-
Haemonetics Corporation (HAE) – HAE outperformed after a strong quarter, with plasma demand and share gains driving a higher outlook. CSL, a core plasma customer, is returning a portion of collections to HAE, validating its platform. We remain attracted to its recurring revenue base, vascular closure opportunity, and operating leverage.
-
Atkore Inc. (ATKR) – ATKR outperformed after agreeing to be acquired by Prysmian in an all-cash deal. We anticipate the transaction will be completed in the 4Q.
-
Qualys, Inc. (QLYS) – QLYS was a top contributor after a strong quarter, with accelerating billings and a raised outlook. AI has shifted from a perceived disruption risk to a cybersecurity tailwind, increasing the importance of QLYS’ integrated platform, durable position, and strong cash generation.
Top 3 Detractors from Relative Performance
-
Acushnet Holdings Corp. (GOLF) – GOLF declined on concerns around tougher second-half comparisons despite strong results and a raised outlook. Early demand for new golf clubs pulled some sales forward, while rounds played and pricing remained healthy. We remain attracted to its leading golf ball franchise, premium brands, and ability to grow through innovation and share gains.
-
Landstar System, Inc. (LSTR) – LSTR declined with trucking stocks as rising insurance and liability costs weighed on sentiment despite improving freight trends. We continue to like its asset-light model, cash generation, and potential to gain share as smaller brokers face pressure.
-
Marten Transport, Ltd. (MRTN) – MRTN declined after results missed expectations, though trends improved sequentially. Pricing improved in truckload, while the industry remained pressured by driver shortages. We remain attracted to its strong balance sheet and earnings upside as freight conditions recover.
Sector Influence
We are bottom-up stock pickers, but sector exposures influenced relative performance as follows:
-
What Helped: Underweight Utilities (a weaker performing sector)
-
What Hurt: Underweight Health Care (a better performing sector)
Trades During the Quarter
-
Exited: UniFirst Corporation (UNF) – Sold following the announced acquisition by Cintas (CTAS). The stock was trading near the deal price. In addition, because CTAS’ market cap is well outside our small-cap investable universe, we chose to exit the position before closing rather than receive CTAS shares.
-
Initiated: Churchill Downs Incorporated (CHDN) – CHDN is a business we know well from other portfolios. CHDN owns a unique collection of racing, gaming, and entertainment businesses, anchored by the Kentucky Derby, one of the most iconic events in sports. Its regional casinos and historical racing venues generate steady, recurring cash flow in markets where regulation limits new competition. Management has been an excellent steward of capital, investing in high-return projects, buying back shares opportunistically, and exiting businesses that fall short of its standards, an approach that has driven strong cash flow growth. Recent share price weakness created an attractive entry point, as the market appears focused on near-term uncertainties while overlooking its lasting strengths. We believe this combination of irreplaceable assets, durable cash generation, and disciplined leadership, at today’s more attractive valuation, fits our Quality-at-a-Reasonable-Price approach and positions CHDN to compound shareholder value over the long term.
-
Increased: McGrath RentCorp (MGRC) – Added to the name to complete a full 3% position, reflecting our confidence in the long-term thesis.
-
Exited: Enovis Corporation (ENOV) – Exited our position reflecting a loss of confidence in management following a recently announced acquisition. The position was relatively small, and we didn’t have conviction to add to it.
-
Increased: Vontier Corp (VNT) – Addition reflects improving operating results and what we believe remains an attractive valuation, with healthy demand across most of the business, cost savings progressing well, and continued share repurchases.
Looking Ahead
The economic backdrop remains supportive in many respects. Growth is solid, manufacturing and services activity are improving, and corporate earnings continue to exceed elevated expectations. At the same time, the headwinds have grown more pronounced. The Fed has begun tightening, energy prices and Treasury yields are elevated, and higher borrowing and living costs are weighing on consumers, particularly at the lower end of the income spectrum. The AI investment cycle remains a powerful engine of growth. Yet, its scale invites comparisons to past infrastructure booms, where investors who were right about the buildout still endured significant drawdowns along the way. Early signs of stress have also emerged in the lowest tiers of credit. While we do not attempt to predict the path of rates or the economy, we believe these crosscurrents argue for discipline.
From an equity market perspective, headline index strength continues to mask a narrower reality. A concentrated group of AI-linked companies has driven a disproportionate share of returns, while many stocks have moved independently of, or opposite to, the index. Passive flows have reinforced that concentration, and benchmarks once considered defensive now carry more technology exposure and higher beta than their labels suggest. Quality has historically lagged when rates rise, but if higher rates begin to pressure corporate balance sheets, the attributes we emphasize should matter more: strong returns on capital, conservative leverage, durable dividends, and reasonable valuations. We view these attributes as important ballast and a complement to more concentrated growth exposures. We remain confident that our portfolios are well positioned to participate as fundamentals reassert themselves while helping to manage downside risk.
Annualized Returns
As of 9/30/2026
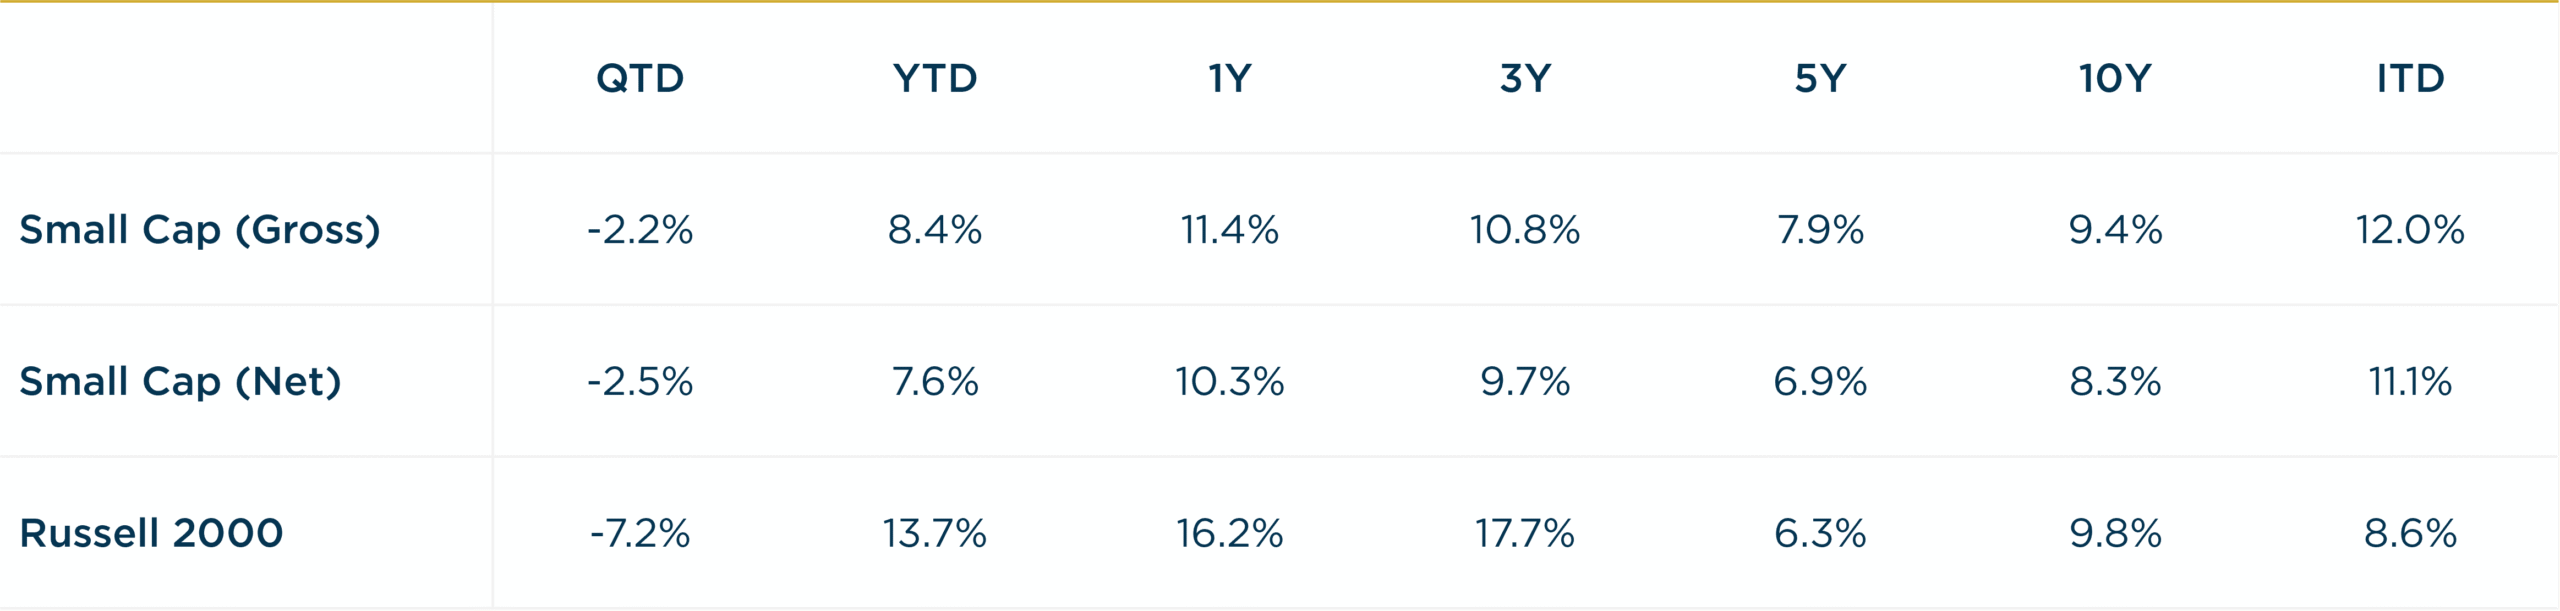
Inception date: 9/30/1999. Performance is preliminary. Subject to change. Past performance should not be taken as a guarantee of future results. Net of fee returns are calculated net of an annual model management fee of 1.00%. Please see the disclosure notes found on the bottom of the page.