Market Observations & Portfolio Commentary
SMID Cap – 1Q2026 vs. Russell 2500
Market Update
U.S. equities were mostly lower in the first quarter of 2026. The Russell 3000 declined 4%, and the S&P 500 posted its first quarterly decline in a year. The year began on a constructive note as declining yields, improving leading indicators, and rising mortgage applications supported a broadening rally. However, sentiment reversed sharply in March following the Iran conflict escalation. The near-blockage of the Strait of Hormuz sent crude oil surging over 75%, reigniting inflation fears and shifting the Fed narrative from rate cuts to potential hikes.
Equity market leadership changed sharply as the quarter progressed. Early cyclical broadening gave way to a narrow, commodity-driven market that benefited energy, agriculture, and hard-asset industries. Large-cap Growth was the only style box to post double-digit losses, hampered by Big Tech weakness and AI displacement concerns in software. Conversely, Small Caps proved resilient; the Russell 2000 finished higher while the Equal-Weight S&P 500 remained flat. Sector dispersion was extreme in the S&P 500, with Energy surging over 35% while Technology fell over 9%. From a factor perspective, Value, Momentum, and Yield drove returns. Quality was mixed, while Growth and Volatility factors detracted.
Key Performance Takeaways
-
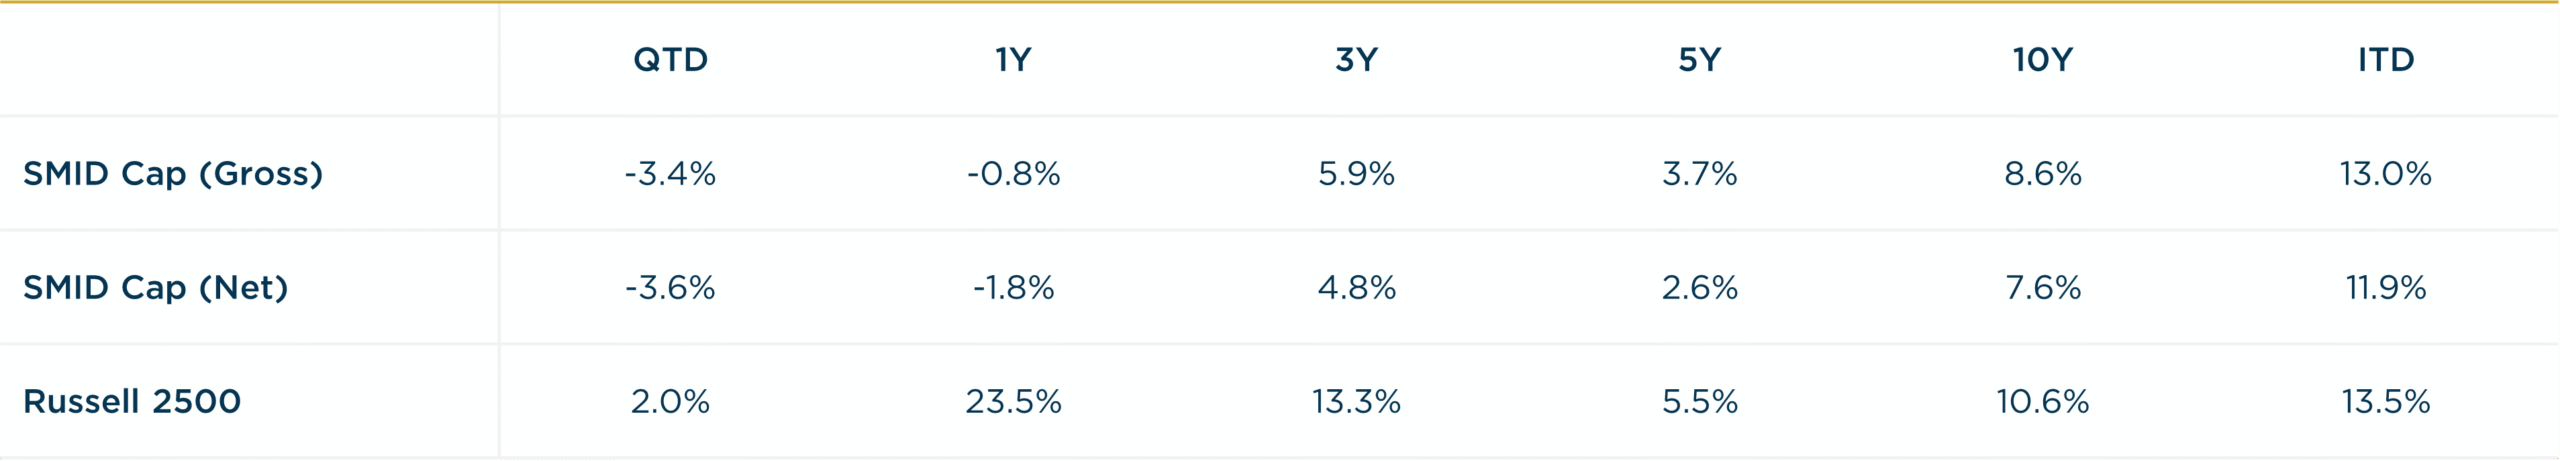
The London Company Small-Mid Cap portfolio declined 3.4% (-3.6% net) during the quarter vs. a 2.0% increase in the Russell 2500 Index. Both sector exposure and stock selection were headwinds to relative performance.
-
The SMID portfolio trailed its benchmark in Q1 and came up short of our 85-90% upside capture expectations. Early signs of broadening gave way to a narrower, macro-driven market where our structural underweight to Energy and commodity-linked industries was a significant detractor—similar to early 2022 when Russia invaded Ukraine. Lower-quality, more speculative areas also proved surprisingly defensive. While frustrating, we’ve navigated analogous periods before. These rotations have historically been short-lived and we don’t believe recent price action reflects a fundamental change in the long-term case for our holdings. Should geopolitical and supply-shock volatility persist, we expect investors to refocus on quality. The durable competitive advantages and financial flexibility of our businesses position the SMID portfolio well across a range of environments.
Top 3 Contributors to Relative Performance
-
Entegris, Inc. (ENTG) – ENTG was a top contributor, benefiting from improving fab utilization and accelerating AI-driven semiconductor demand. The company continues to gain share as advanced node transitions increase materials intensity per wafer. Looking ahead, fundamentals are improving with higher wafer starts, near-full utilization, and multiple growth drivers across advanced logic and memory. With its investment cycle largely complete and free cash flow expected to improve, we remain attracted to its strong competitive positioning and high barriers to entry.
-
Murphy USA, Inc. (MUSA) – MUSA outperformed in Q1 alongside the spike in fuel prices. Higher prices support top-line growth and cash flow. The company should also gain market share through its everyday low-price strategy in this environment. We expect excess cash flow generated during this period to be returned to shareholders. The company’s low-cost rural/suburban positioning and consistent capital return program continue to create shareholder value.
-
Element Solutions Inc (ESI) – ESI rallied on strong demand for specialty chemicals across electronics and industrial coatings end markets. Quarterly results were solid, supported by strong performance in the Electronics business. Recent integrations have expanded their product offerings, providing incremental earnings from high growing businesses. ESI’s timely investments, smart capital allocation and focus on higher growth end markets should enable the company to maintain its outperformance and margin expansion.
Top 3 Detractors from Relative Performance
-
Qualys, Inc. (QLYS) – Despite a strong earnings report, QLYS sold off sharply as Anthropic’s announcements around Claude’s cybersecurity capabilities triggered indiscriminate selling across cyber names. We believe QLYS maintains defensible moats in its niches, and AI systems remain unsuitable for domains where errors carry severe consequences. The strong balance sheet and cash generation provide flexibility to invest in product innovation and drive market share gains. The risk/reward here is compelling for long-term holders.
-
Churchill Downs Incorporated (CHDN) – CHDN fell as regional gaming revenue softened and legislation concerns about i-gaming continued. We believe these concerns are overdone and note that CHDN has responded rationally, buying back shares on weakness. CHDN has strong tailwinds ahead of the upcoming Derby, and the company has the optionality to create value through the potential sale of its regional casino portfolio.
-
Armstrong World Industries, Inc. (AWI) – AWI declined on weaker commercial construction activity and destocking in distribution channels. These factors were outside the company’s control, but management partially offset the impacts through growth initiatives. Enhanced visibility in the backlog and momentum from initiatives pair well with AWI’s pricing power, leading market position and recovering end markets.
Sector Influence
We are bottom-up stock pickers, but sector exposures influenced relative performance as follows:
-
What Helped: Underweight Health Care (a weaker performing sector) & overweight Materials (a better performing sector)
-
What Hurt: Underweight Energy (the best performing sector) & overweight Consumer Discretionary (a weaker performing sector)
Trades During the Quarter
-
Initiated: Cooper Companies (COO) – COO is a global medical device company operating two divisions: CooperVision (contact lenses, >65% of revenue) and CooperSurgical (women’s healthcare). CooperVision is a high-quality business in an oligopolistic industry where four players control 95% of the market. COO benefits from high customer switching costs, leading positions in faster-growing specialty lenses, and deep customer relationships that have driven above-market growth. While margins currently trail peers due to a multi-year investment cycle, significant expansion potential exists as capex moderates. Recent share price weakness reflects cyclical pressures rather than fundamental deterioration, activist involvement creates a catalyst for operational improvements. Valuation is attractive, supported by recent insider buying.
-
Increased: CCC Intelligent Solutions Holdings Inc (CCC) – We added to our position amid weakness driven by temporarily slower new-product penetration and AI-related concerns. We believe concerns over AI disintermediation are overstated, as adoption of CCC’s AI-enabled products continues to gain traction. CCC’s deeply embedded platform and network effects across the insurance and repair ecosystem continue to strengthen its competitive moat.
-
Reduced & Exited: Axalta Coating Systems Ltd. (AXTA) – We exited following recent strength and market cap constraints ahead of the planned Akzo Nobel merger.
-
Reduced & Exited: Waters Corporation (WAT) – We exited following recent strength and market cap constraints after the combination of WAT and Becton Dickinson’s Biosciences & Diagnostic Solutions business.
-
Exited: Trex Company, Inc. (TREX) – Sold after reassessing competitive positioning following James Hardie’s acquisition of AZEK. Increased competition may pressure market share and require higher marketing spend.
-
Increased: Churchill Downs Incorporated (CHDN) – We added to CHDN on weakness driven by regulatory concerns and regional gaming softness. We believe these risks are overstated, while CHDN’s regulatory moat, irreplaceable Derby franchise, and disciplined capital allocation support attractive long-term value.
-
Increased: Qualys, Inc. (QLYS) – We added following weakness after the company guided to slower near-term growth. As AI increases the scale of cyber threats, we believe demand for automated risk management should support long-term growth. QLYS’s deep integration within customer IT environments and extensive security data support durable competitive advantages.
-
Increased: ACI Worldwide, Inc. (ACIW) – We added on recent weakness despite solid execution. ACIW’s mission-critical payments infrastructure remains deeply embedded across global banks, supporting high retention and recurring revenue. The shift toward real-time and cross-border payments positions ACIW well for continued payment network modernization.
Looking Ahead
The situation in Iran and the broader macro backdrop remain very fluid. The coming months should provide greater clarity on whether recent events prove more inflationary, more demand-destructive, or some combination of both. While we do not attempt to forecast the path of geopolitics or the broader economy, we recognize that macro-driven disruptions can overwhelm fundamentals in the short run. Even so, history suggests that supply shocks and geopolitical events, while meaningful in the near term, rarely redefine the long-term earnings power of advantaged businesses.
From an equity market perspective, breadth and leadership may remain uneven as markets digest shifting macro narratives. We continue to view the recent setback as a pause in a multi-year broadening cycle rather than a lasting reversal. Prior broadening episodes have often been choppy, but also durable, unfolding over years rather than quarters. In that environment, we believe portfolios emphasizing high-quality businesses with durable competitive advantages, strong returns on capital, pricing power, flexible balance sheets, and reasonable valuations are well positioned. In a market where breadth and leadership can shift quickly, we believe those characteristics position our portfolios to participate when fundamentals reassert themselves while helping to manage downside if volatility persists.
Annualized Returns
As of 3/31/2026
Inception date: 3/31/2009. Performance is preliminary. Subject to change. Past performance should not be taken as a guarantee of future results. Net of fee returns are calculated net of an annual model management fee of 1.00%. Please see the disclosure notes found on the bottom of the page.