To clients and friends of The London Company
History Never Repeats Itself, but It Does Often Rhyme
Executive Summary
- Two of the biggest surprises this year have been the resilience of the economy and the strength of the stock market.
- The top-heavy nature of the S&P 500 creates an environment prone to volatility and risk reversals.
- Demand for growth and speculative hype associated with AI has pushed valuations back into historically elevated territory.
- Narrow markets are fragile markets. Uncertainty remains high entering the second half of 2023, and we expect greater volatility ahead.
“2 years ago we were selling at 10 times revenues when we were at $64. At 10 times revenues, to give you a 10-year payback, I have to pay you 100% of revenues for 10 straight years in dividends. That assumes I can get that by my shareholders. That assumes I have zero cost of goods sold, which is very hard for a computer company. That assumes zero expenses, which is really hard with 39,000 employees. That assumes I pay no taxes, which is very hard. And that assumes you pay no taxes on your dividends, which is kind of illegal. And that assumes with zero R&D for the next 10 years, I can maintain the current revenue run rate.
Now, having done that, would any of you like to buy my stock at $64? Do you realize how ridiculous those basic assumptions are? You don’t need any transparency. You don’t need any footnotes. What were you thinking?”
Given the ongoing Artificial Intelligence (AI) honeymoon phase gripping markets, we’re reminded of the now infamous 2002 statement above from Scott McNealy, Co-Founder & CEO of Sun Microsystems. Sun Micro was one of the darlings of the Tech Bubble. Between 1996 and 2006, the stock made a roundtrip from $5/share back to $5/share, but at its peak, in 2000, the stock reached $64/share and a valuation of 10x revenues. We believe Scott’s quote is an important reminder for investors today. AI euphoria is partially responsible for the broad market’s positive Q2 and YTD returns, but it’s also still a story. Stories often help investors overlook the negative. As we sit here today, there are tangible risks in the current market backdrop that share early parallels with that of the Tech Bubble.
Two of the biggest surprises this year have been the resilience of the economy and the strength of the stock market. As the expression goes, a ‘watched pot never boils,’ and ‘the most anticipated recession of all time’ has yet to fully materialize in conventional, broad-based terms. While we’ve seen hints of a ‘rolling recession,’ US consumer spending has helped buttress the broader economy, thanks in part to solid household balance sheets and a tight labor market. Turning to equities, the S&P 500 was up for a 3rd straight quarter and is up 16.9% YTD. Importantly, the first half strength of Market Cap weighted indexes like the S&P 500 and NASDAQ was driven by a handful of mega-cap technology stocks. Colloquially dubbed the ‘Magnificent 7,’ the seven largest stocks by market capitalization in the S&P 500 (Apple, Microsoft, Amazon, NVIDIA, Alphabet, Tesla & Meta Platforms) contributed 74% of the S&P 500’s YTD return.
At first glance, the index level returns seem at odds with the Fed’s continued tightening bias and many leading economic indicators, which are at recessionary levels. A look beneath the surface, however, reveals a bifurcated market, where stocks down the capitalization spectrum are more reflective of concerns over the economy’s trajectory. Mid and Small Cap stocks have lagged their Large Cap brethren, and the concentrated, narrow leadership from the Magnificent 7 was reflected in the 10% spread between the YTD returns for the S&P 500 market cap and equal weight indexes—the 4th widest positive spread on record. Style, sector, and factor leadership largely mimicked what we saw in Q1. Growth continued to dominate Value, and the growth oriented Info Technology, Cons. Discretionary and Comm. Service sectors generally led across the market cap spectrum. The hard vs soft landing tug-of-war was reflected in market factors. Quality’s momentum from Q1 largely faded; meanwhile, Volatility factors bounced on renewed hopes of cyclical recovery. Yield and Value factors continue to be the biggest laggards year-to-date.
One parallel with today’s market and that of the Tech Bubble is the top-heavy nature of the S&P 500 and its historically narrow market leadership. The Magnificent 7 make up 28% of the S&P 500 index, and their average YTD return was an eye-popping 89%. The strength of this group has been supported by broad economic growth scarcity, the bank failure-induced moderation in yields and AI enthusiasm. As shown below, the percent of S&P 500 stocks outperforming the overall index touched a record low in early June, surpassing the prior low set in March 2000. It’s not uncommon for the largest stocks to dominate performance in cap-weighted indexes, but when the majority of member stocks are underperforming the overall index, concentration risks become elevated. Narrow markets are fragile markets, and the top-heavy nature of the S&P 500 creates an environment prone to volatility and risk reversals. Somewhat ironically, one of the primary benefits of indexation and passive investing is risk diversification, but the current concentration in growthy technology stocks may be far too aggressive for the average investor. As a high-conviction manager, we support focused investing, but being intelligently diversified and having balance in your portfolio are key to lowering concentration risk.
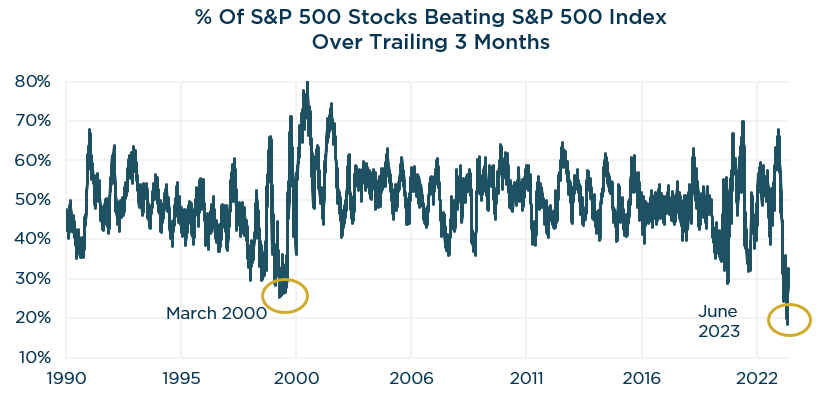
Source: Piper Sandler
Another Tech Bubble parallel is the elevated valuation backdrop and speculative hype associated with AI. The S&P 500’s current forward P/E of 19x is below the 24x Dot Com Bubble peak and the 23x COVID Bubble Peak, but it still ranks in the 84th percentile versus history. Since the October’22 bear market low, 100% of the S&P 500’s rally is attributable to P/E multiple expansion—not earnings growth. Most of that multiple expansion is attributable to the Magnificent 7. Importantly, this group of mega-cap technology companies isn’t a monolith that’s wholly dependent on AI. The top-line growth, profitability & balance sheet strength offered by some of these businesses has attracted speculators and long-term investors alike. From here, we’ll need to see these companies deliver on their earnings expectations in order to justify some of their lofty valuations. As it relates to AI, we believe it will have a significant impact on how we live and work over time, and there will certainly be big winners long term. Unfortunately, the timing of all that is uncertain. If the commercialization of the internet is any guide, it’s important to not confuse innovation with value creation. Valuation alone is a poor timing tool in the short term, but it matters for investors’ long-term returns. One of the biggest lessons from the Tech Bubble is that overpaying for future growth is costly to investment returns.
Strategy Recap
Turning to our performance, The London Company portfolios saw mixed results in Q2. Our Mid Cap and SMID portfolios outperformed their respective benchmarks, and our Large Cap portfolio captured roughly 90% of the upside in the Russell 1000 index—in line with expectations. Our Small Cap portfolio trailed its benchmark, and our Income Equity portfolio trailed both the Russell 1000 Value and S&P 500. As we’ve outlined, the concentrated dominance of a handful of stocks were major obstacles for our Large Cap and Income Equity strategies. The re-emergence of soft-landing optimism led to a low quality, cyclical rally in the Russell 2000, and our Small Cap portfolio failed to keep pace.
Looking at the first half of the year, the performance divergence across the market cap spectrum contributed to different relative YTD results for our portfolios. Our Mid Cap, SMID, and Small Cap portfolios all outperformed their benchmarks. As fundamentals have come under pressure down cap, our Quality orientation has stood out. Meanwhile, our Large Cap and Income Equity portfolios have lagged their benchmarks. A combination of zero exposure and under-exposure to the surging Magnificent 7 stocks accounted for most of our underperformance. Between our Large Cap and Income Equity portfolios, we’ve had sizable positions in three of these stocks for many years, because they fit our process. Nevertheless, the benchmark weight and concentrated strength of this group diminished our ability to differentiate from the indexes. It wasn’t all opportunity cost; however, a handful of stock specific headwinds were also to blame. Additionally, Yield factors have dramatically lagged so far in 2023, which was another headwind for our Income Equity portfolio.
While narrow markets are never easy to navigate, we’re conditioned to being out of sync with leadership trends over the short term. We never expect to keep pace in robust markets or when market leadership favors stocks with a high story-to-substance ratio. Part of practicing a successful investing discipline is avoiding temptation. While short-term deviations from our benchmarks can be expected, we’ll never bend our portfolios to the will of the mania du jour.
Part of practicing a successful investing discipline is avoiding temptation. While short-term deviations from our benchmarks can be expected, we’ll never bend our portfolios to the will of the mania du jour.
Looking Ahead
Uncertainty remains high as we enter the second half of 2023. We see positive signs ahead, but also potential risks. Continued progress on the inflation front is encouraging, and labor market strength may continue to underpin consumer resilience. Additional bright spots include improvement in housing and a boom in manufacturing construction spending. Plus, it’s been more than eight months since the October’22 lows, and the S&P 500 is up >20% off the bottom—technically a new bull market! If history is any guide, the odds of probing deeper bear market lows are limited. Given the numerous shocks to the global economy and the sheer amount of fiscal and monetary meddling over the past three years, it would seem that almost anything is possible. That said, we remain cautious, because we believe the odds of a recession are still high and a credit crunch may be on the horizon. The inversion of the yield curve, a hawkish Fed, stricter lending standards, and the continued drain of liquidity from the system all weigh heavily on the risk side of the ledger. Moreover, we’ve started to see cracks emerging in the economy. Unemployment claims have been steadily increasing, albeit from historically low levels, and the pace of corporate bankruptcies is on par with 2020 and 2009. If claims continue to rise, we suspect credit deterioration will follow, which could put downside pressure on equities.
Putting it all together, narrow markets are fragile markets, and we expect greater volatility ahead. With a possible recession and the S&P 500 trading at 19x forward estimates, modest returns over the next few years still seem like a reasonable expectation. It remains to be seen whether we see the Magnificent 7 catch down or if everyone else catches up, but we would urge investors to not be complacent, especially as the list of historical analogs keeps expanding. We were around for the lead up to the Dot Com collapse, and we have the scar tissue to prove it. We successfully helped our clients navigate the Tech Bubble and subsequent ‘Lost Decade.’ We’re certainly not calling for another ‘Lost Decade,’ but if the next decade’s leadership rhymes with history then we may see a more egalitarian market in the years ahead. One that favors a quality value orientation, lower market capitalizations, high active share and attractive shareholder yields. By that measure, we believe our portfolios are well positioned and built for long-term durability.
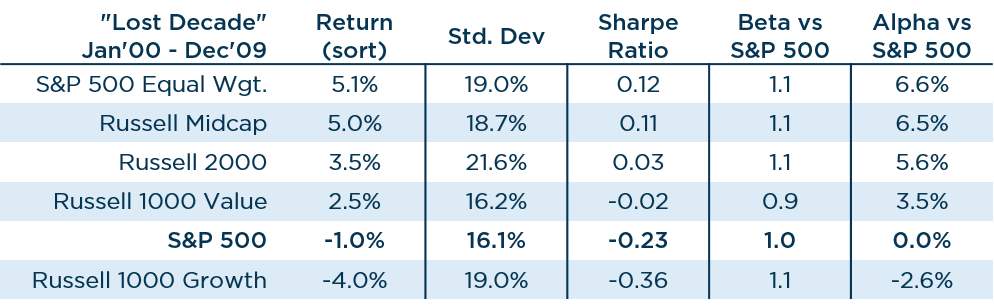
Source: Zephyr
In the spirit of bridging timeless wisdom with modern innovation, we’ve enlisted the help of AI to assist with our conclusion this quarter. We asked ChatGPT to summarize the investment takeaways from renowned economist John Kenneth Galbraith’s famous book, “A Short History of Financial Euphoria.” Per ChatGPT, the five main takeaways are 1.) Recognize the presence of financial euphoria, 2.) Exercise caution during periods of euphoria, 3.) Understand the inevitability of market corrections, 4.) Study financial history, and 5.) Be mindful of the role of psychology in markets. Adherence to these tenants can help us all avoid being asked the question that Scott McNealy posed in our opener, “What were you thinking?”
Finally, we’re pleased to announce that we’ve added two new hires to the ranks of our existing 12-person investment team. Thaddeus (TJ) Carter, CFA, CPA has joined The London Company as a Portfolio Manager. TJ brings nearly 20 years of experience investing in equities across both U.S. and Non-U.S. markets. Prior to joining The London Company, TJ spent 9 years at Barrow Hanley Global Investors as a Portfolio Manager and Analyst for both the Global Value and Non-U.S. Value strategies, he also led the Non-U.S. Value research process. TJ graduated from the University of Arkansas with a BS in Business Administration and received his MBA from Columbia Business School. Josh Mack has also joined The London Company as a Research Associate. Josh recently graduated from Stonehill College. He interned with us last summer, and we’re glad to have him back. With the addition of TJ and Josh, the depth of our investment team has never been better. We continue to reinvest in our business, and we view these additions as another important step for The London Company in our goal of remaining a sustainable and multi-generational firm.
View Our Strategies
For more information