To clients and friends of The London Company
Momentum Madness
Executive Summary
- Sticky inflation and strong labor market data pushed out the timeline for the Fed’s first rate cut. Despite a rise in yields, the S&P 500 surged 10.6% in Q1, notching its strongest start since 2019.
- The Artificial Intelligence (AI) hype that powered 2023’s market rally extended its momentum into 2024. Although there were signs of some rotation away from the dominance of mega-caps, leadership dynamics largely remained unchanged.
- The weight of high momentum stocks is at an all-time high. A recent surge in insider selling activity, especially in tech companies, likely reflects the extreme valuations and unsustainability of this AI momentum trade.
- For our portfolios, the relative advantage of our Quality-orientation was strongest down the market cap spectrum. The dominance of Momentum, Growth, & Volatility factors were headwinds for our large cap portfolios.
- The odds of a recession have come down, but our cautious posture persists due to high valuations, market concentration, looming debt challenges, and the lengthiest inversion of the yield curve in history.
Momentum dynamics ran rampant across equity markets during Q1, similar to what we see each year in the NCAA college basketball tournament. March Madness reliably brings us examples of college teams that go on hot streaks at just the right time. While the short-term action can be enticing, momentum has a way of working until it doesn’t. Just as a team’s hot streak can suddenly fizzle out, the short-term hype and excitement of momentum rallies eventually dissipates. Through Q1, however, that hot streak continued as the broad market notched a second straight double-digit quarterly gain.
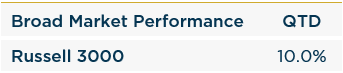
Market enthusiasm persisted in Q1, with the S&P 500 gaining 10.6%—its strongest start since 2019. The big story for Q1 was the market’s ability to continue to rally despite a rise in yields. Sticky inflation and strong labor market data pushed out the timeline for the Fed’s first rate cut. Typically, a rise in yields has a negative effect on asset prices. So, what is driving the market’s appreciation this year? We suspect some FOMO (fear of missing out) was a contributing factor. Often times, higher asset prices beget higher asset prices, and the AI hype that powered 2023’s market rally extended its momentum into 2024.
Notably, there was a discernible increase in dispersion among the Magnificent 7 mega-cap stocks, accompanied by a broader market rally. Although there were signs of some rotation away from the dominant mega-caps, leadership dynamics largely remained unchanged along with a bifurcated earnings landscape. While Small Cap earnings faced headwinds stemming from stubbornly elevated cost structures and weak volumes, Large Cap companies emerged as a bright spot, delivering solid profits in the quarter. Market performance continued to be driven by Momentum, Growth, and Volatility market factors, while Yield, Value, and Quality factors lagged behind.
The AI hot streak has drawn a crowd, and now the weight of high momentum stocks is at all-time highs. Momentum, being a dynamic factor influenced by macroeconomic and fundamental conditions, tends to attract increased investor interest during periods of strong short-term performance or thematic trends, often leading to crowded trades and inflated valuations. Such scenarios historically culminate in sharp corrections (i.e. momentum crashes). Since the Great Financial Crisis, similar crowding has been seen in other rallies: the Great Trash Rally (2009-11), the Low Vol Bubble (2014-16) and the COVID-19 High Beta Bubble (2020-21). Today’s Momentum trade is particularly unique due to the extreme tail crowding in mega-cap Growth stocks (.e.g. Magnificent 7 effect). If these same stocks experience significant declines, this idiosyncratic risk could trigger systemic risk and lead to unexpected losses across markets.
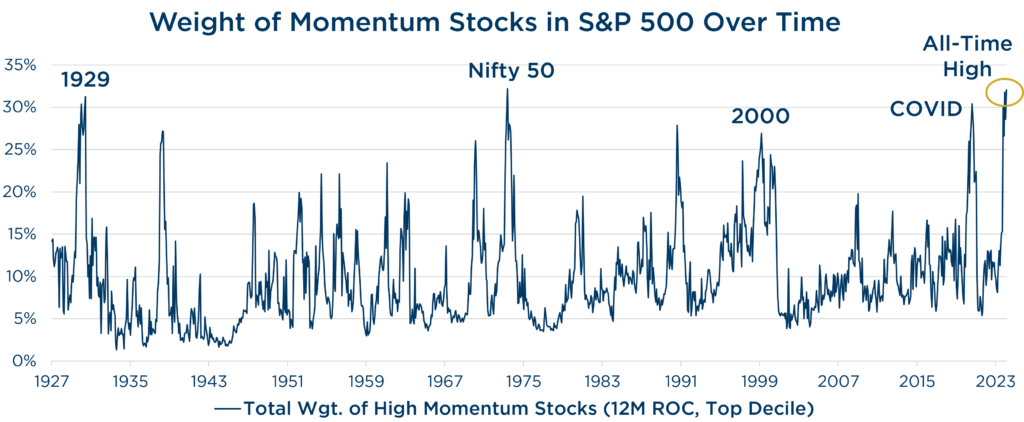
Source: Piper Sandler. Data from 1/1/1927-2/29/2024. Data from pre-1990 Fama French. Data post-1990 S&P 500 Index weight.
Over the past year, we’ve highlighted the risks and fragility that come with narrow, top-heavy markets, and it seems as though corporate insiders have begun to share that view. Insider selling has spiked in recent months, especially among tech companies. We’ve always put a lot of weight on the actions of insiders, and we believe the surge in selling activity reflects apprehensions over the extreme valuations and unsustainability of this AI momentum trade.
Strategy Recap
The London Company portfolios produced solid absolute returns during Q1, but our relative results were mixed. Our Mid, Small-Mid, and Small Cap portfolios far exceeded our expectations of 85-90% of upside capture versus their benchmarks. Our Quality orientation continued to stand out down cap where weakness was more pervasive. Company fundamentals continued to drive price, and the strong balance sheets of our companies—many with net cash—remained a significant advantage in this high rate environment.
In the large cap arena, not much has changed since last year, and the relative advantage of our Quality orientation was less pronounced. Our Large Cap and Income Equity portfolios fell short of our upside capture expectations. Our focus on Quality, Yield, and Value factors faced headwinds in a market favoring Momentum, Growth, and Volatility. A handful of mega-cap stocks continued to skew index results, and the opportunity cost of not owning several holdings, like NVidia or Meta Platforms, was significant.
We echo the mantra ‘Offense wins games. Defense wins championships,’ but lately defense hasn’t had much playing time. We’re well past 100 trading days without a -2% pullback from a closing high in the S&P 500—rarefied territory. Further, market complacency is eerily high, as evidenced by equity volatility levels and credit spreads sitting at post-COVID lows. A byproduct of this AI-driven momentum landscape is that many high-quality, low-beta companies are trading far below historical norms. While predicting market cycles is challenging, we anticipate some reversion to the mean for our Large Cap & Income Equity portfolios. We believe their quality portfolio characteristics and attractive valuations can help offset the risks associated with growth stocks and lofty valuation multiples.
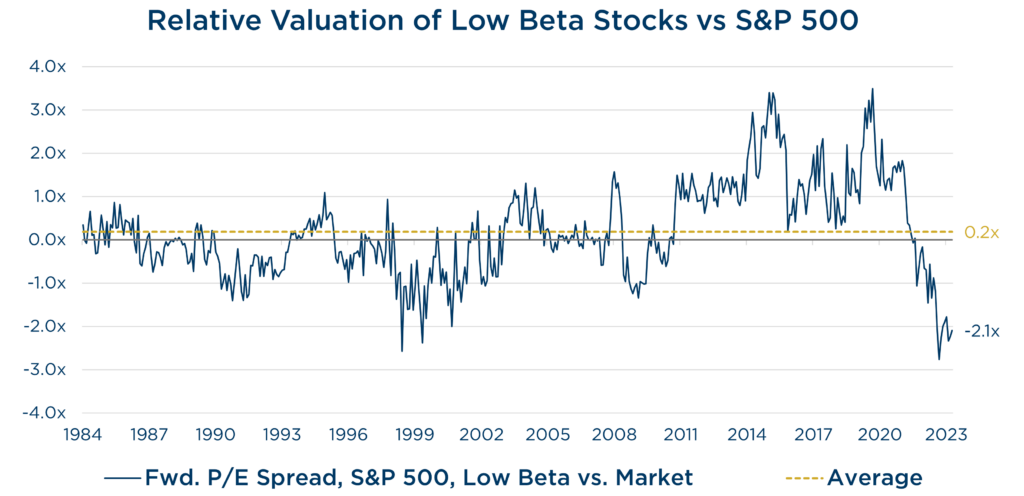
Source: J.P. Morgan. Data from 11/30/84-2/29/2024.
Looking Ahead
After such a strong five-month rally, it’s fair to question the sustainability of the market’s strength. Potential supports include monetary policy that is poised to become less restrictive. Moreover, fiscal stimulus and deficit spending by incumbent governments are unlikely to fall in 2024, given that >4 billion people will be heading to the polls across the globe this year. The odds of a recession have come down, but our cautious posture persists due to high valuations, market concentration, looming debt challenges and the lengthiest inversion of the yield curve in history.
Looking forward, a durable broadening likely relies on earnings growth. P/E valuation multiple expansion has done the bulk of the heavy lifting in recent years, but continued multiple expansion in a higher rate environment is unlikely. We suspect the S&P 500 will eventually track earnings, so we would expect more volatility, especially in stocks where a lot of growth is already priced in. Given the exceptionally strong run in equities over the past five years and looming headwinds on the horizon, we wouldn’t be surprised to see some reversion to the mean—both in terms of returns moving lower and risk moving higher. With that in mind, we see a greater opportunity for quality operators with durable cash flow generation, strong balance sheets and attractive shareholder yields in the years ahead.
In college basketball and investing, episodes of momentum come and go, but quality and consistency are attributes that typically win in the end. Some teams can get hot and go on runs, but regression typically occurs over the course of six games. We believe our track record of consistency and commitment to Quality will help us ‘cut down the nets’ for our clients and our partners over the long term.
As always, we appreciate and highly value the trust you have placed in us.
A byproduct of the momentum surge is that low beta & low volatility stocks now trade at historically wide discounts to the S&P 500.
View Our Strategies
For more information