Observations Down the Market Cap Spectrum
Valuations for Small & Mid cap stocks trade at wide relative discounts to Large Caps and attractive levels respective to historical averages, presenting a compelling opportunity for long-term investors.
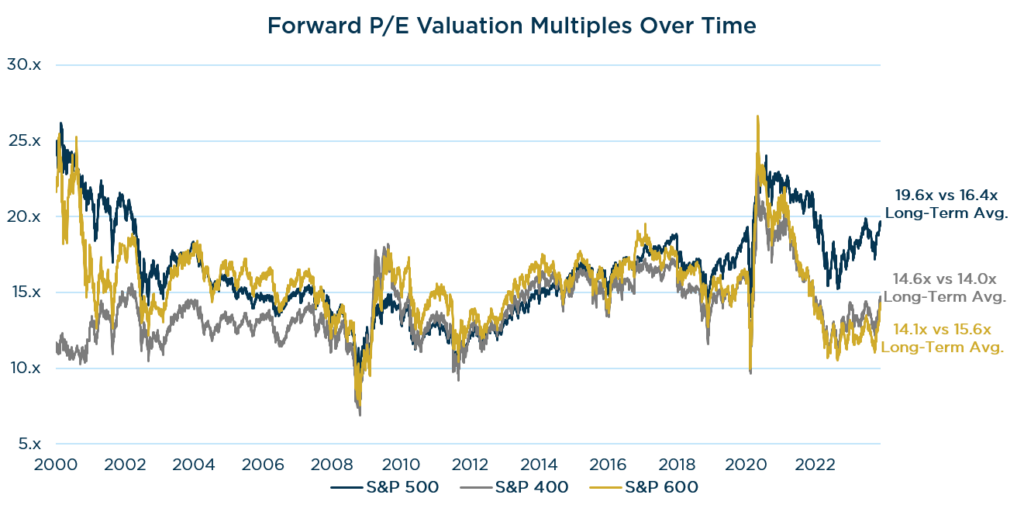
Source: FactSet. Data as of 1/31/00 – 12/31/23. Past performance should not be taken as a guarantee of future results.
The Good News – Small Cap Valuations Appear Attractive
Looking back over the past 50+ years, valuations of Small Cap stocks relative to Large Caps are historically attractive and at levels not seen since the early 2000s.
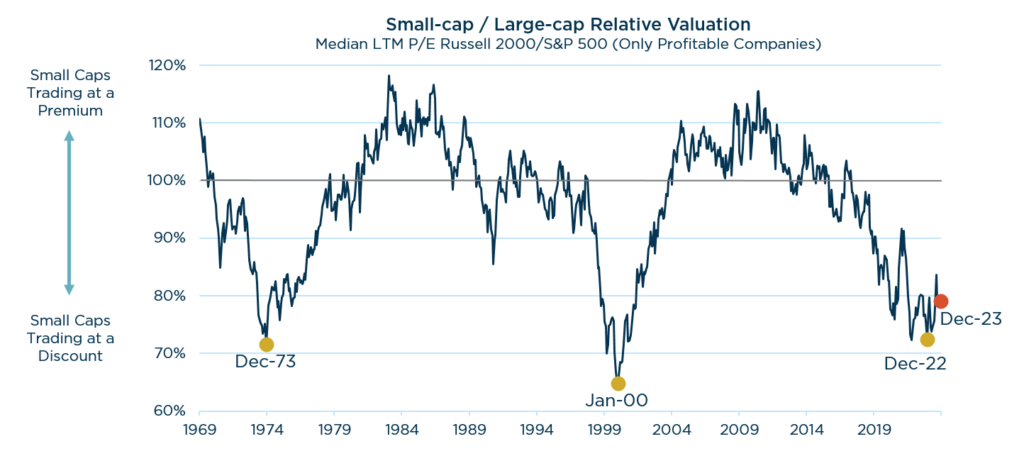
Source: Furey Research Partners as of 12/31/2023. Past performance should not be taken as a guarantee of future results.
Significant Challenges & Key Considerations
Quality has been deteriorating for years
- The percent of smaller cap companies with no earnings has risen significantly over the last decade.
- Additionally, quality has deteriorated, as leverage ratios have been increasing.
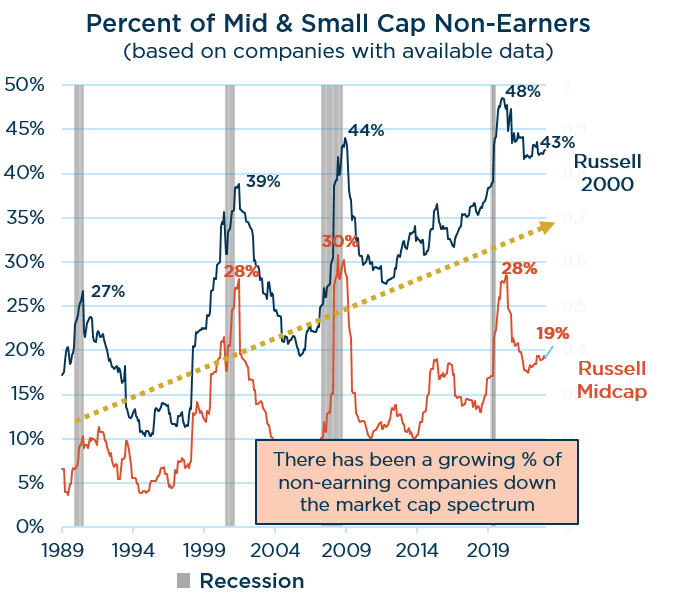
Source: Strategas as of 12/31/2023. Past performance should not be taken as a guarantee of future results.
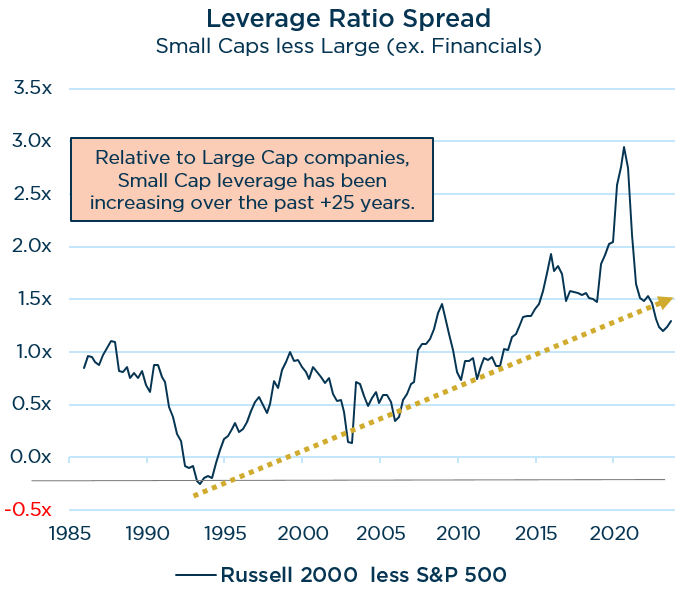
Source: Furey Research Partners as of 12/31/2023. The leverage ratio represents Net Debt/EBITDA. Past performance should not be taken as a guarantee of future results.
Cost of Capital In Perspective
Historical Influence & Implications Moving Forward
Over the past 10+ years, abundant access to cheap debt largely eliminated any performance differential between high and low quality Small Cap companies. That may be set to change.
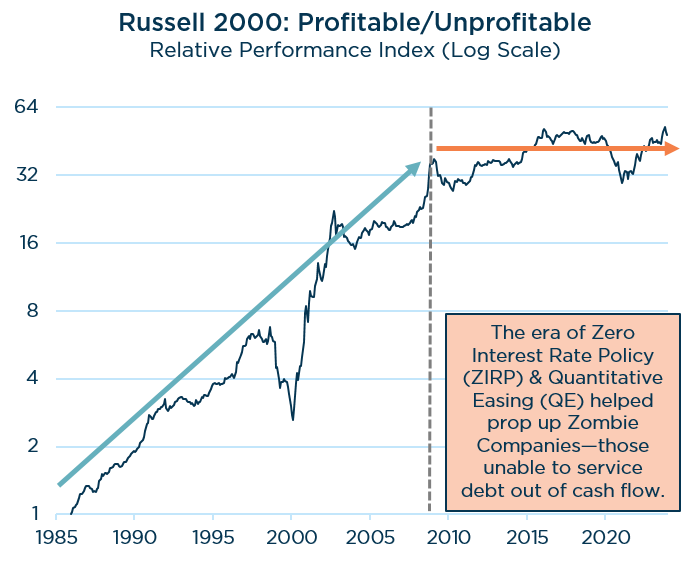
Source: Furey Research Partners as of 12/31/2023. Past performance should not be taken as a guarantee of future results.
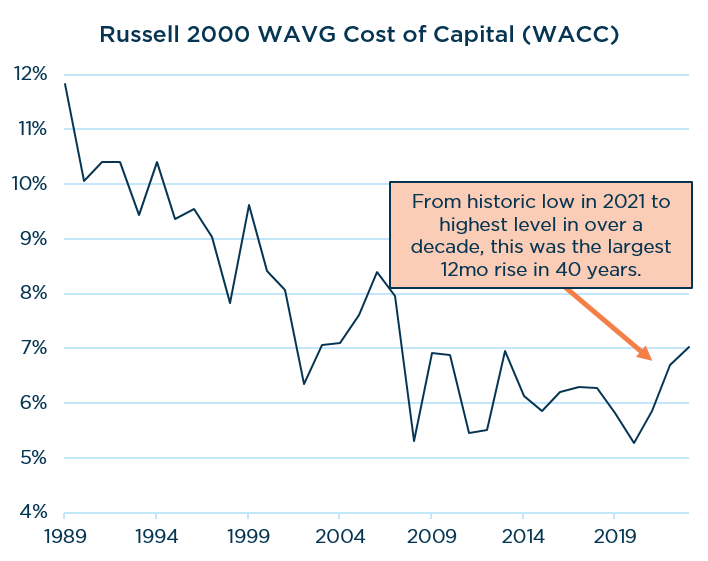
Source: Furey Research Partners as of 12/31/2023. Past performance should not be taken as a guarantee of future results.
Now that the decade of abnormally suppressed interest rates is over, the cost of capital is on the rise AND nearly 50% of S&P 1500 debt matures in the next five years when refinancing will be much more expensive.
Looking Ahead: Debt Maturity Wall Creeping Into View
While there are still no signs of a credit crunch, rising debt servicing costs will likely become a growing part of the macro conversation, especially if rates stay ‘higher for longer.’
- Elevated debt loads coupled with the higher rates presents major refinancing risk going forward. Servicing that debt may cut into corporate profits, capital spending, hiring, economic growth and investor returns.
- Tight credit spreads are an artifact of the now-expiring stimulus effects. With the era of cheap money over, the interest burden will be going up, which will likely favor higher quality businesses with healthy balance sheets.
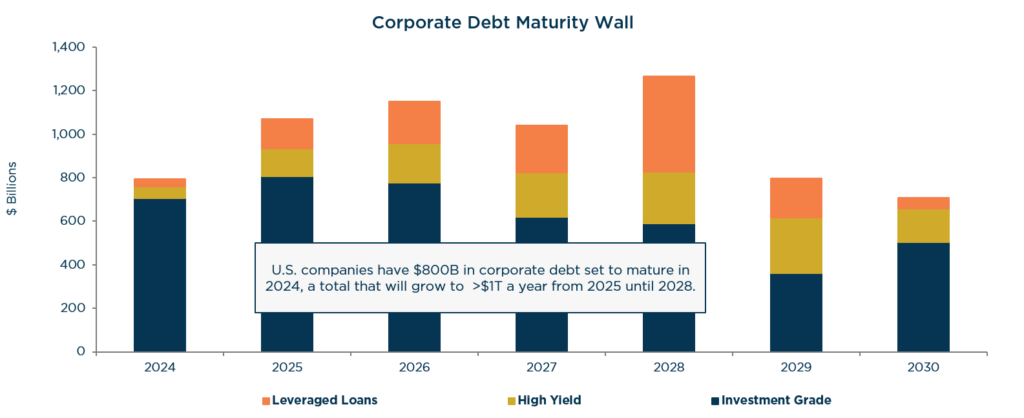
Source: Goldman Sachs. Past performance should not be taken as a guarantee of future results.
Why The London Company Down Cap?
We believe our Small, SMID and Mid Cap portfolios are well positioned to capitalize on attractive relative valuations while avoiding the pitfalls associated with low-quality, smaller cap companies.
- Companies with sustainably high and improving returns on capital provide downside protection and have outperformed over the long term.
- Attributes like a strong balance sheet and the ability to self-finance operations are poised to stand out as tangible competitive advantages in a higher cost of capital environment.
- Pricing power allows companies to pass through inflationary costs
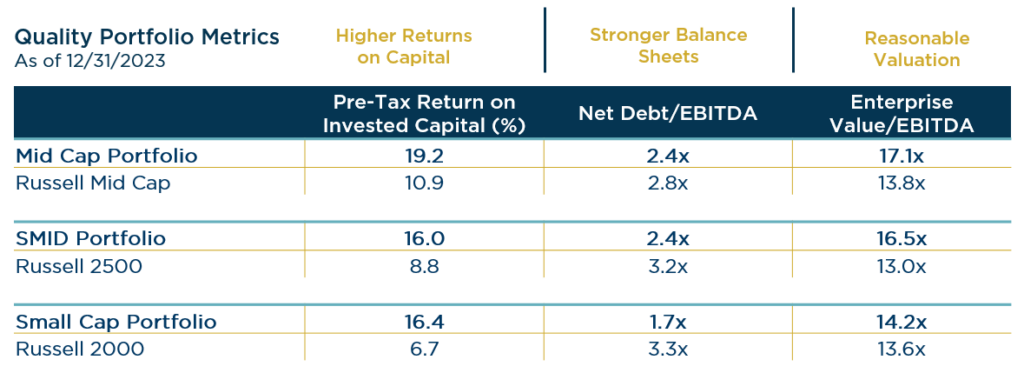
Source: FactSet. Past performance should not be taken as a guarantee of future results.
Benefits of Down Cap Quality Over Time
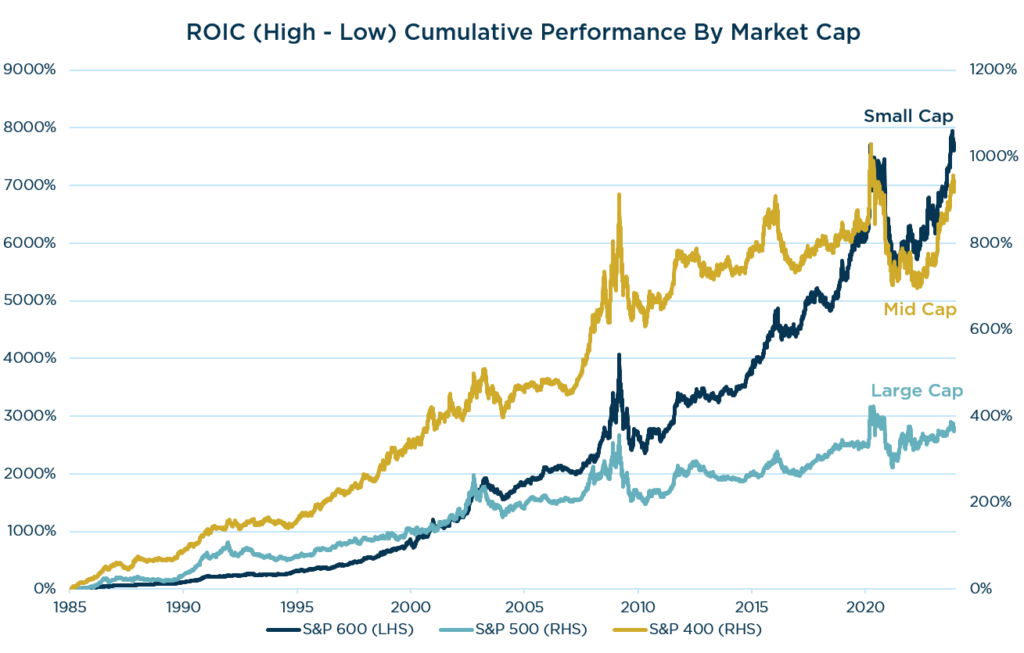
Source: Piper Sandler as of 12/31/23. Past performance should not be taken as a guarantee of future results.
Lost Decade Analog & Historical Precedent
Should the next decade more closely resemble a period of interest rate normalization & elevated volatility, a higher quality approach to smaller cap investing could stand out in a meaningful way.
- Going forward, as the Fed normalizes policy, a higher cost of capital environment will likely shape the contours of the investment landscape for years to come.
- This comes at a time when quality among smaller cap companies has eroded over the past decade.
- The last time relative valuations were as attractive (early 2000) and the interest rate environment was more normalized (a period much like the one we may be entering), The London Company’s Small Cap portfolio generated meaningful excess returns and substantially lower levels of volatility over the ensuing decade.
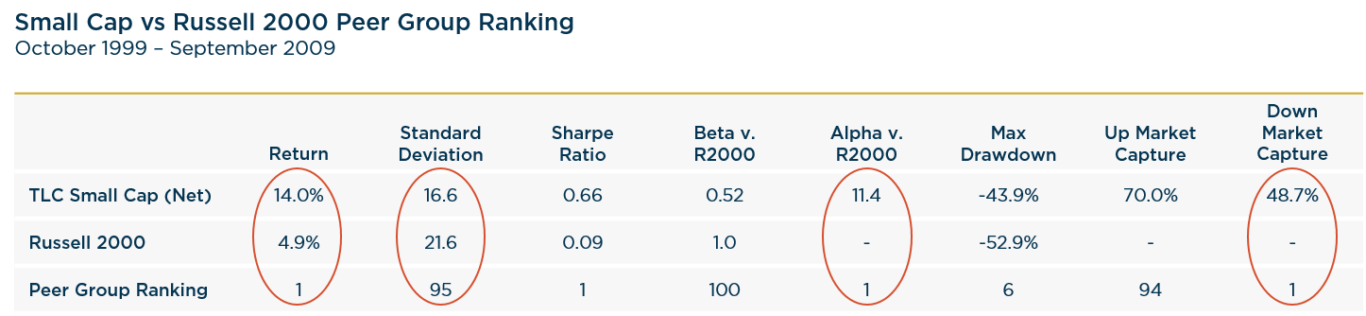
Source: eVestment. Rankings for the period were pulled on 2/9/2023. Peer ranking based on eVestment US Small Cap Core Equity Universe.
Past performance should not be taken as a guarantee of future results.
A Quality Value Approach to Small & Mid Cap Investing
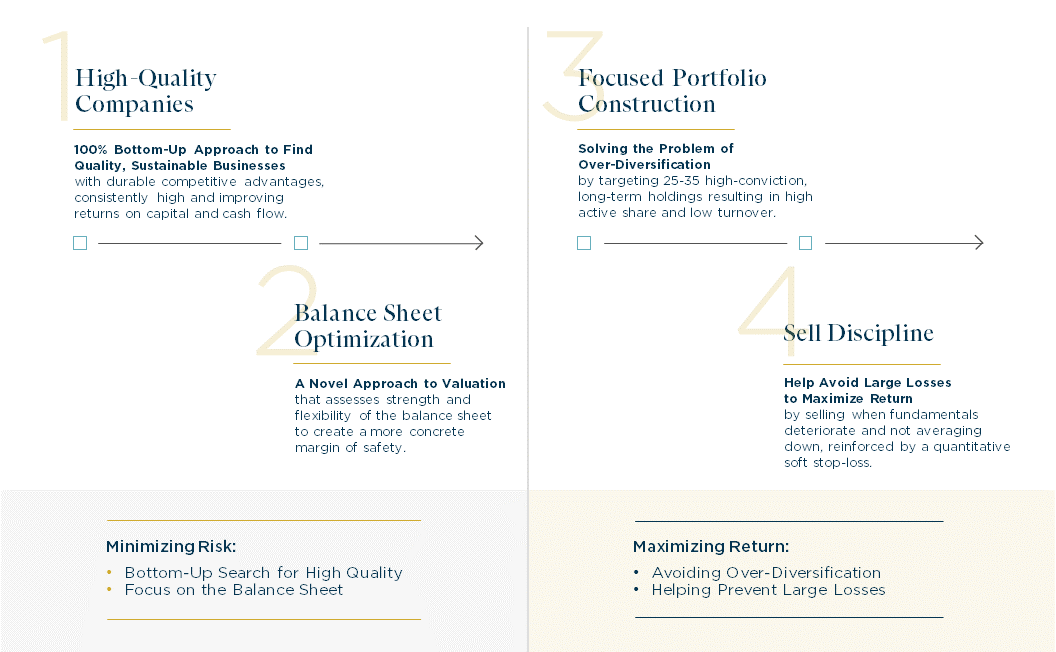
Learn More about our investment philosophy.
Small Cap Performance Review
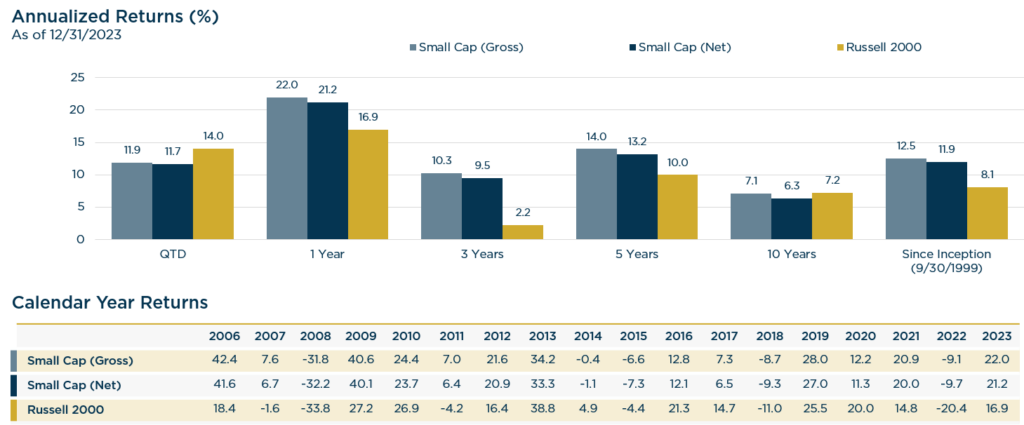
Performance shown should, under no circumstances, be construed as an indication of future performance. All are encouraged to read and understand the disclosure notes found below.
SMID Cap Performance Review
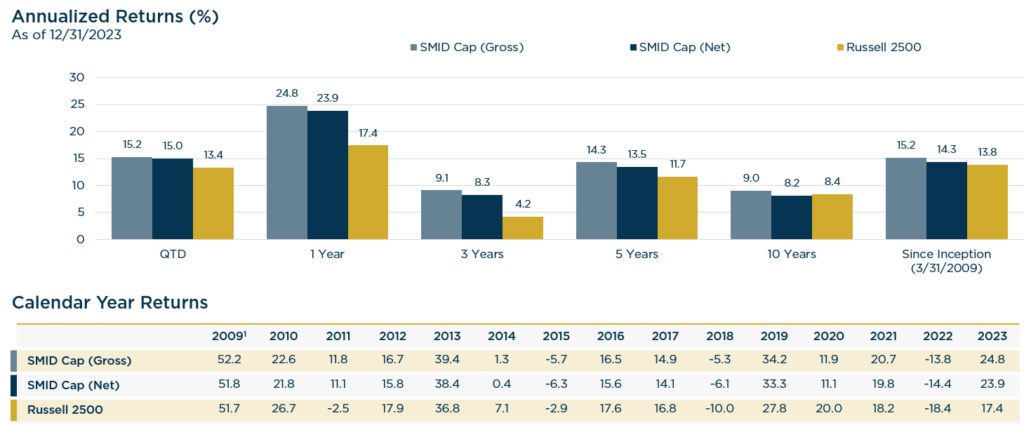
1Year ending 12/31/2009 represents nine months of returns.
Performance shown should, under no circumstances, be construed as an indication of future performance. All are encouraged to read and understand the disclosure notes found below.
Mid Cap Performance Review
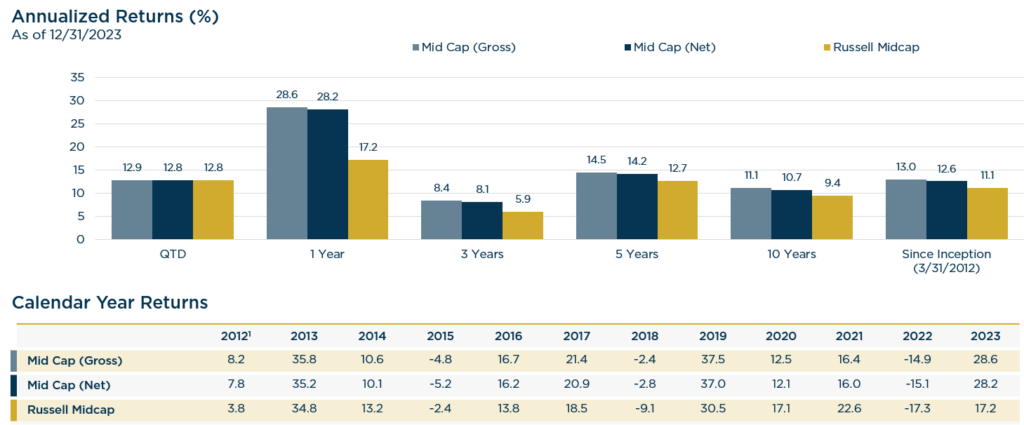
1Year ending 12/31/2012 represents nine months of returns.
Performance shown should, under no circumstances, be construed as an indication of future performance. All are encouraged to read and understand the disclosure notes found below.
Our Investment Process