FY International Equity – 2025 vs MSCI EAFE
Market Observations & Portfolio Commentary
International Equity – 2025 vs MSCI EAFE
Full Year Market Update
Global equity markets posted strong gains in 2025. In developed markets, the MSCI World index returned 21.1%. International and Emerging markets bested the U.S. markets by a wide margin. The MSCI EAFE and MSCI EM posted impressive 31.2% and 33.6% returns, respectively; meanwhile, the S&P 500 returned 17.9%. Importantly, the weak U.S. Dollar added a little over 10% points to the MSCI EAFE’s return. Economic indicators across the Eurozone, UK and Asia were mixed but provided a stabilizing picture, as the initial shock and uncertainty from U.S. administration trade policies faded throughout the year. The EU kept policy rates unchanged, but the UK eased rates on cooling inflation. In Asia, Japan reported a better economic picture, with GDP growth and stable unemployment. The policy rate was tightened by 25 bps to 0.75%, as the Bank of Japan continues to normalize rates. China was a mixed bag with GDP ticking up and unemployment stable while industrial production slipped. Despite differing policy rate moves, we observed yield curve steepening across most developed markets.
In equity markets, Europe led Asian markets in 2025. MSCI Japan returned 24.6% and MSCI China increased 31.2%; meanwhile, MSCI Europe reported a strong 35.4% return. Stylistically, Value led Growth. All sectors delivered positive returns in 2025, led by Financials and Utilities. Within Financials, it was Banks again that led the charge, with a +70% gain for the year. Turning to market factors, the Value, Yield, Momentum and Volatility factors were positive contributors in 2025. Growth was mixed, while Quality factors faced sharp headwinds.
Key Performance Takeaways for the Year
-
The International Equity portfolio returned 17.6% gross (16.7% net) year-to-date vs a return of 31.2% for the MSCI EAFE index. Sector exposure & stock selection were headwinds to relative performance.
-
The International Equity portfolio trailed its benchmark and came up short of our 85-90% upside participation expectations in 2025. A strong rally in high-beta, deep value stocks drove gains in international markets, which our Quality-focused, Lower-Volatility portfolio did not fully capture. The Bank industry, for example, was the biggest contributor to the MSCI EAFE index performance, with a +70% return in 2025. This was a significant opportunity cost for our quality-oriented portfolio during the year.
-
While we fell short of our upside capture objective, our strategy delivered compelling absolute performance in 2025, and has maintained solid upside capture since inception. Our discipline is designed to protect capital during frothy periods and deliver steadier results when the cycle turns.
Top 3 Contributors to Relative Performance
-
BAE Systems PLC (BA/ LN) – BA/ LN, the leading UK defense contractor, was a top contributor in 2025, delivering strong operational execution alongside a clear improvement in long-term visibility. Markets responded positively to solid financial results and accelerating European and NATO defense spending commitments, which reinforced expectations for sustained multi-year growth across the sector. We remain attracted to this high-quality defense franchise with strong competitive positioning and durable end-market tailwinds.
-
Taiwan Semiconductor Manufacturing Co., Ltd. Sponsored ADR (TSM) – TSM, the leading semiconductor fabrication company, performed strongly in 2025. Earnings consistently expectations, validating our thesis around robust semiconductor demand, particularly tied to AI and advanced computing. The market rewarded improving visibility into utilization rates and pricing power, reflecting confidence in TSM’s ability to capture outsized value from structural growth trends.
-
Safran SA (SAF FP) – SAF FP was a strong contributor driven by robust commercial aerospace aftermarket growth, positive defense sentiment, and disciplined execution. The market reacted favorably to sustained demand for narrow-body aircraft engines, where SAF FP’s joint venture with GE commands roughly 75% market share and remains the primary value driver. SAF FP’s competitive advantages, long-term structural growth tied to global air travel, and strong cash generation fit well within our quality framework.
Top 3 Detractors from Relative Performance
-
Compass Group PLC (CPG LN) – CPG LN shares were weighed down by a valuation de-rating as organic growth momentum slowed from post-pandemic highs. As the leading contract catering company, CPG LN enjoys steady, defensible growth and continued to have a successful year outperforming peers. Despite the short-term weakness, CPG LN continues to execute well, take market share, and benefit from accelerating outsourcing trends across corporate and institutional clients.
-
London Stock Exchange Group PLC (LSEG LN) – LSEG LN underperformed as slower growth in recurring revenues, a disappointing update from a peer, and broader AI-related concerns weighed on market sentiment. The market reaction reflected short-term uncertainty rather than a deterioration in LSEG LN’s strategic position. Fundamentally, LSEG LN remains a leading provider of mission-critical data, analytics, and exchange services in a structurally growing market, supported by high switching costs and strong customer relationships.
-
Air Products and Chemicals, Inc. (APD) – APD’s new CEO used 2025 as a reset year, addressing the prior team’s missteps and value destructive capital allocation. These actions temporarily weighed on volumes and profits, but the business is now on a de-risked path towards higher structural profitability. The core industrial gas business continues to offer meaningful downside protection in a sluggish environment.
Sector Influence
We are bottom-up stock pickers, but sector exposures influenced relative performance as follows:
-
What Helped: Underweight Health Care & Consumer Discretionary (two weaker performing sectors)
-
What Hurt: Underweight Financials & Utilities (the two best performing sectors)
Portfolio Characteristics & Positioning
We believe the International Equity portfolio is positioned for long-term durability and possesses the fundamental ingredients that stand the test of time: wide moats, sustainable high return on capital, strong free cash flow generation, low leverage ratios and shareholder focused management teams. The portfolio trades at a premium to the MSCI EAFE index, but we believe this is justified as companies in the index have lower returns on capital and higher leverage. In an elevated cost of capital environment, we believe companies with strong balance sheets and the ability to self-fund their operations could have a structural advantage going forward.
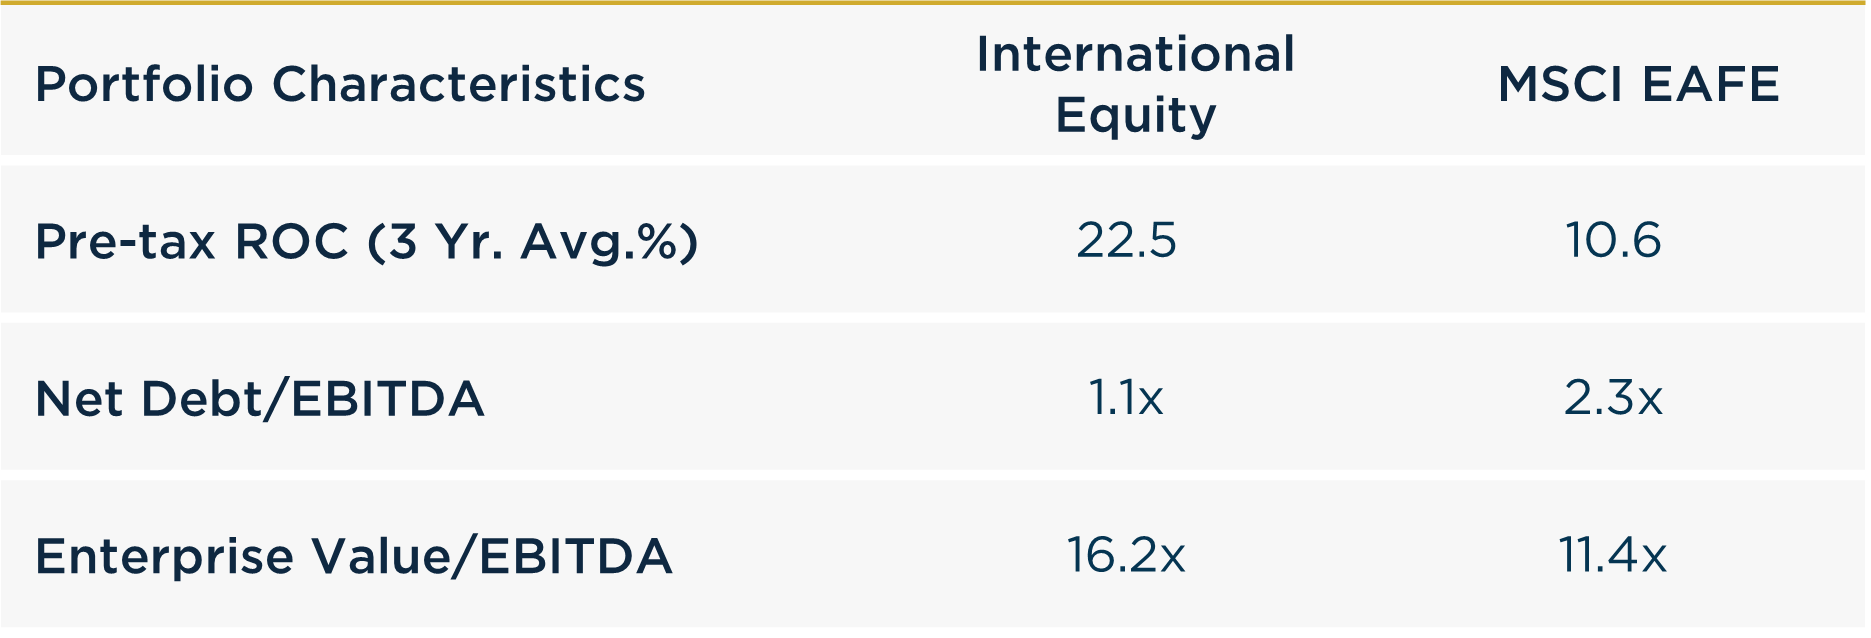
Source: Bloomberg.
Looking Ahead
As we move into 2026, the economic and policy backdrop remains characterized by a mix of support and uncertainty. From an economic perspective, we expect modest economic growth across the developed international markets with balanced risks from sticky inflation, unemployment and trade flare-ups. In terms of policy rates, we continue to expect an accommodative posture from Europe and UK central banks while Japan looks to continue normalizing rates into 2026 – similar trend from 2025. We expect continued focus on domestic policies around defense spending and infrastructure, which should be supportive to domestic growth.
In terms of equities, we maintain a favorable view of the international landscape. In 2025, international markets delivered stellar returns, supported by earnings growth, multiple expansion and U.S. Dollar weakness. Even after such a strong year, international markets are still valued at a sizeable discount to the U.S. We believe this will continue to be supportive of fund flows into international markets providing a positive outlook into 2026. Beneath the surface, returns for the year in the MSCI EAFE were driven by the low-quality businesses; meanwhile, Quality factors were significantly out of favor. We don’t believe this trend can last forever. We’re well positioned for such a reversal, with a portfolio of attractively valued quality businesses that can outperform the market cycle while providing solid downside protection.
Annualized Returns
As of 12/31/2025
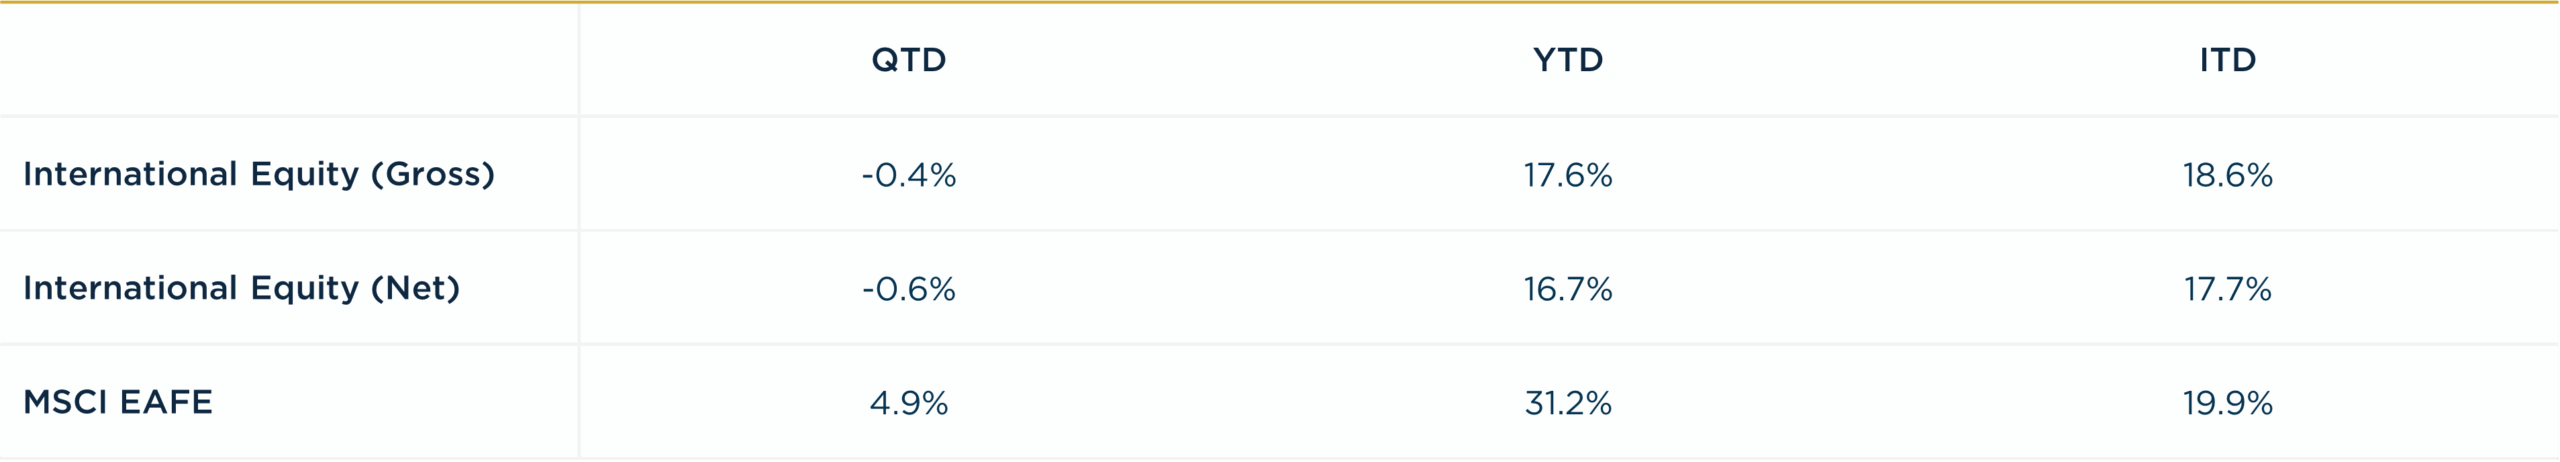
Inception date: 9/30/2023. Performance is preliminary. Subject to change. Past performance should not be taken as a guarantee of future results. Net of fee returns are calculated net of an annual model management fee of 0.75%. Please see the disclosure notes found on the bottom of the page.